WSSU total enrollment is approximately 5,169 students. 4,033 are undergraduates and 320 are graduate students.
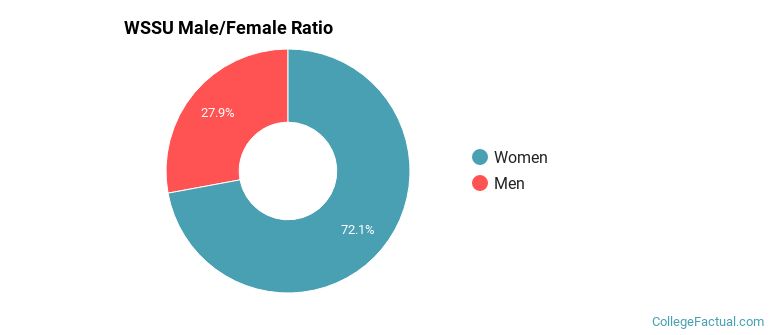
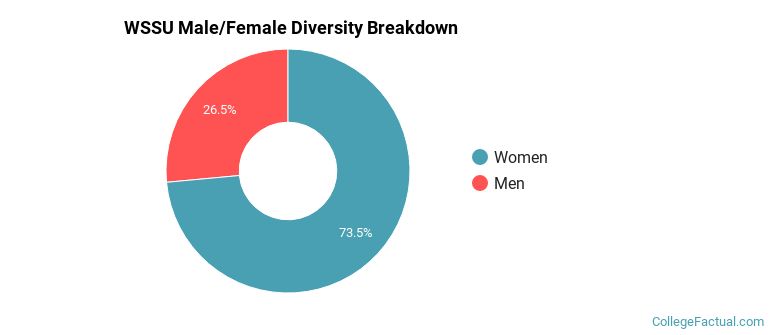
Male/Female Breakdown of Undergraduates
The full-time WSSU undergraduate population is made up of 75% women, and 25% men.
For the gender breakdown for all students, go here.
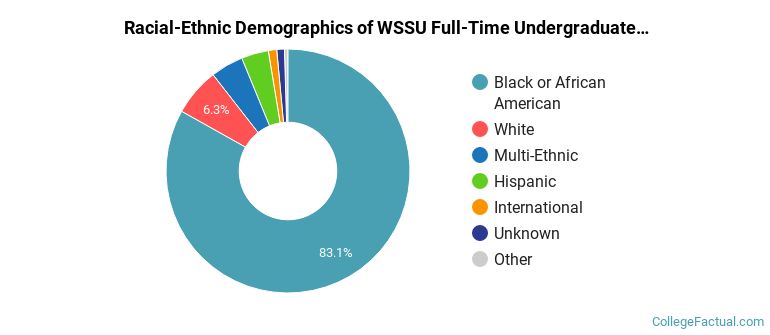
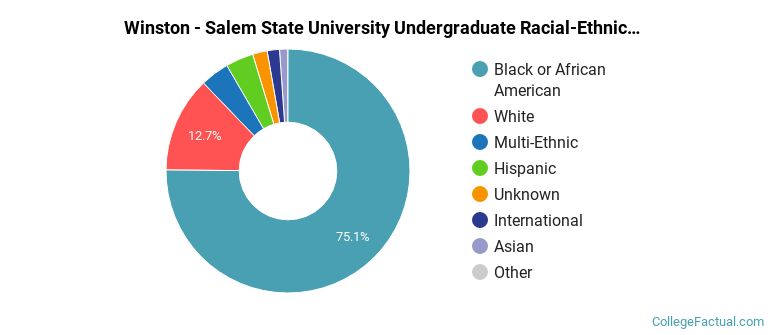
WSSU Racial/Ethnic Breakdown of Undergraduates
| Race/Ethnicity | Number |
|---|---|
| Black or African American | 3,237 |
| Unknown | 270 |
| Multi-Ethnic | 173 |
| Hispanic | 157 |
| White | 120 |
| International | 40 |
| Asian | 25 |
| Native Hawaiian or Pacific Islander | 1 |
See racial/ethnic breakdown for all students.
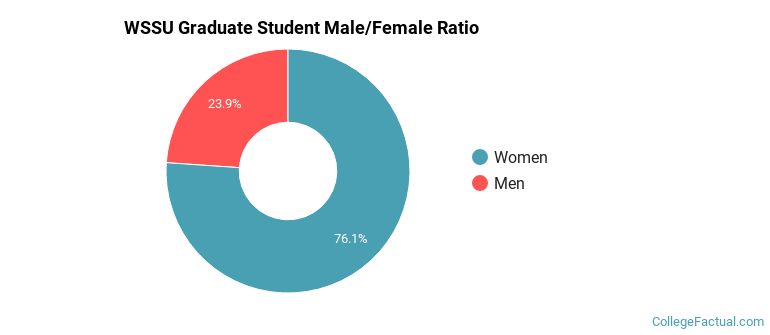
Male/Female Breakdown of Graduate Students
About 81% of full-time grad students are women, and 19% men.
For the gender breakdown for all students, go here.
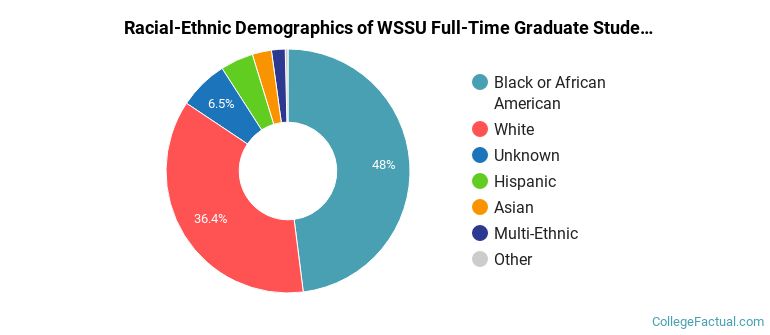
WSSU Racial-Ethnic Breakdown of Graduate Students
| Race/Ethnicity | Number |
|---|---|
| Black or African American | 135 |
| White | 106 |
| Unknown | 38 |
| Hispanic | 17 |
| Asian | 10 |
| Multi-Ethnic | 6 |
| International | 5 |
| Native Hawaiian or Pacific Islander | 0 |
See racial/ethnic breakdown for all students.
| Race/Ethnicity | Number |
|---|---|
| Black or African American | 3,710 |
| White | 448 |
| Unknown | 446 |
| Hispanic | 220 |
| Multi-Ethnic | 193 |
| International | 76 |
| Asian | 61 |
| Native Hawaiian or Pacific Islander | 1 |
There are approximately 3,925 female students and 1,244 male students at WSSU.
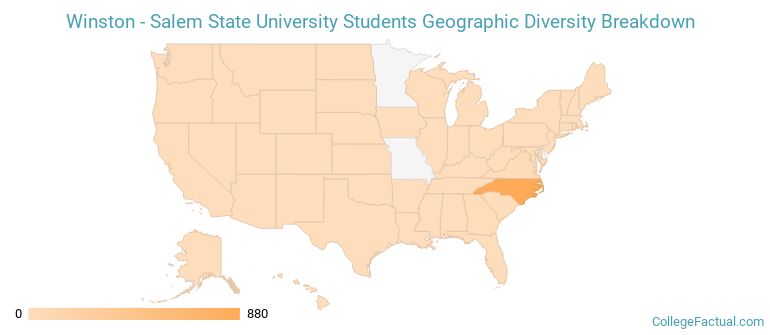
WSSU ranks 1,559 out of 2,183 when it comes to geographic diversity.
7.06% of WSSU students come from out of state, and 0.21% come from out of the country.
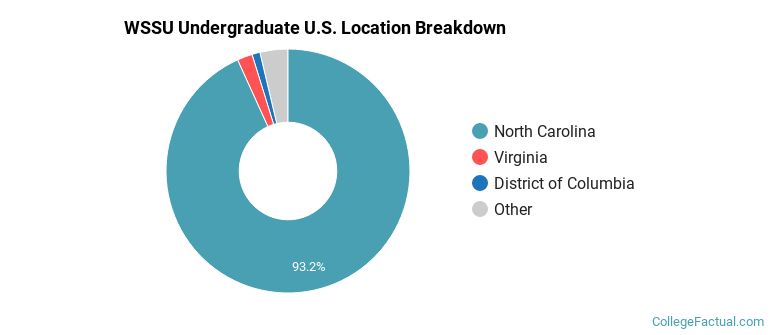
The undergraduate student body is split among 16 states (may include Washington D.C.). Click on the map for more detail.
| State | Amount |
|---|---|
| North Carolina | 880 |
| Virginia | 19 |
| District of Columbia | 10 |
| South Carolina | 8 |
| Georgia | 5 |
Students from 15 countries are represented at this school, with the majority of the international students coming from China, Saudi Arabia, and Philippines.
Learn more about international students at WSSU.
A traditional college student is defined as being between the ages of 18-21. At WSSU, 58.08% of students fall into that category, compared to the national average of 60%.
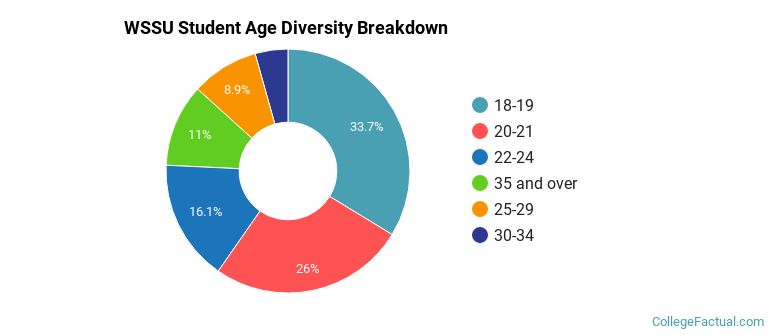
| Student Age Group | Amount |
|---|---|
| 18-19 | 1,673 |
| 20-21 | 1,288 |
| 22-24 | 797 |
| 35 and over | 544 |
| 25-29 | 443 |
| 30-34 | 216 |
| Under 18 | 0 |
Footnotes
*The racial-ethnic minorities count is calculated by taking the total number of students and subtracting white students, international students, and students whose race/ethnicity was unknown. This number is then divided by the total number of students at the school to obtain the racial-ethnic minorities percentage.
References
Department of Homeland Security Citizenship and Immigration Services
Image Credit: By Jerrye & Roy Klotz, MD under License
Learn more about how College Factual creates their Diversity Rankings.