
In its yearly rankings, College Factual analyzes over 2,000 colleges and universities to determine which ones are the best in a variety of categories, such as overall value, quality, diversity, which schools are the best for each major, and much more.
Wisconsin Indianhead Technical College was awarded 24 badges in the 2025 rankings. The highest ranked major at the school is health & medical administrative services.
Explore the best ranked schools for the programs you are most interested in.
WITC is ranked #588 out of 2,152 schools in the nation for overall quality on College Factual's 2025 Best Colleges list. This is an improvement over the previous year, when WITC held the #821 spot on the Best Overall Colleges list.
WITC is also ranked #19 out of 46 schools in Wisconsin.
See all of the rankings for Wisconsin Indianhead Technical College.
If you are worried about getting into Wisconsin Indianhead Technical College, don't be. The school has a liberal open admissions policy, which means you only need to meet basic requirements in order to be admitted. Still, be sure to submit a complete application and provide any other requested materials.
The student to faculty ratio is often used to measure the number of teaching resources that a college or university offers its students. The national average for this metric is 15 to 1, but at WITC it is much better at 5 to 1. That's good news for students who want to interact more on a personal level with their teachers.
When estimating how much access students will have to their teachers, some people like to look at what percentage of faculty members are full time. This is because part-time teachers may not have as much time to spend on campus as their full-time counterparts.
The full-time faculty percentage at Wisconsin Indianhead Technical College is 27%. This is lower than the national average of 47%.
The freshmen retention rate of 77% tells us that most first-year, full-time students like Wisconsin Indianhead Technical College enough to come back for another year. This is a fair bit higher than the national average of 68%. That's certainly something to check off in the good column about the school.
During the 2017-2018 academic year, there were 2,818 undergraduates at WITC with 924 being full-time and 1,894 being part-time.
| $0-30 K | $30K-48K | $48-75 | $75-110K | $110K + |
|---|---|---|---|---|
| $7,739 | $8,869 | $10,978 | $13,832 | $14,486 |
The net price is calculated by adding tuition, room, board and other costs and subtracting financial aid.Note that the net price is typically less than the published for a school. For more information on the sticker price of WITC, see our tuition and fees and room and board pages.
While almost two-thirds of students nationwide take out loans to pay for college, the percentage may be quite different for the school you plan on attending. At WITC, approximately 34% of students took out student loans averaging $4,625 a year. That adds up to $18,500 over four years for those students.
Get more details about paying for Wisconsin Indianhead Technical College.
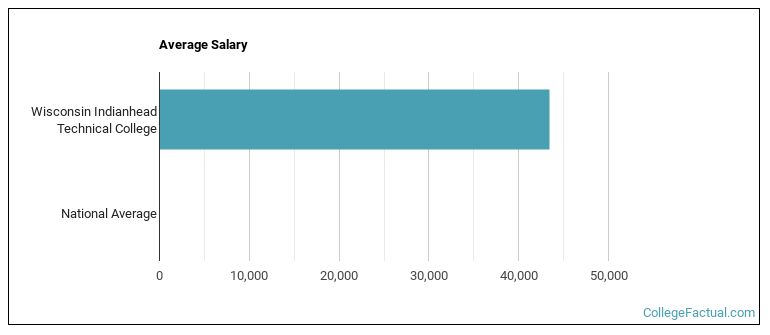
See which majors at Wisconsin Indianhead Technical College make the most money.
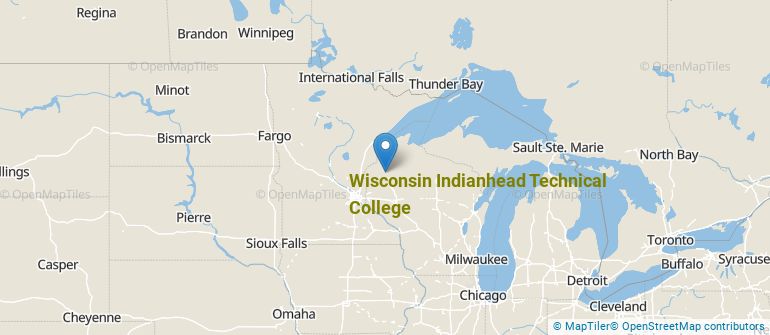
Get more details about the location of Wisconsin Indianhead Technical College.
Contact details for WITC are given below.
| Contact Details | |
|---|---|
| Address: | 1900 College Dr., Rice Lake, WI 54868 |
| Phone: | 800-243-9482 |
| Website: | https://www.northwoodtech.edu/ |
| Most Popular Majors | Bachelor’s Degrees | Average Salary of Graduates |
|---|---|---|
| Precision Metal Working | 392 | NA |
| Health & Medical Administrative Services | 138 | NA |
| Accounting | 123 | NA |
| Teaching Assistants | 97 | NA |
| Gerontology | 93 | NA |
| Nursing | 85 | NA |
| Allied Health Professions | 68 | NA |
| Mental & Social Health Services | 63 | NA |
| Human Development & Family Studies | 55 | NA |
| Heating, Air Conditioning, Ventilation & Refrigeration | 55 | NA |
Online courses area a great option for busy, working students as well as for those who have scheduling conflicts and want to study on their own time. As time goes by, expect to see more and more online learning options become available.
In 2022-2023, 1,889 students took at least one online class at Wisconsin Indianhead Technical College. This is a decrease from the 1,939 students who took online classes the previous year.
| Year | Took at Least One Online Class | Took All Classes Online |
|---|---|---|
| 2022-2023 | 1,889 | 659 |
| 2021-2022 | 1,939 | 717 |
| 2020-2021 | 2,481 | 832 |
| 2018-2019 | 2,057 | 501 |
Learn more about online learning at Wisconsin Indianhead Technical College.
Footnotes
*The racial-ethnic minorities count is calculated by taking the total number of students and subtracting white students, international students, and students whose race/ethnicity was unknown. This number is then divided by the total number of students at the school to obtain the racial-ethnic minorities percentage.
References
More about our data sources and methodologies.