Woodbury total enrollment is approximately 1,132 students. 966 are undergraduates and 106 are graduate students.
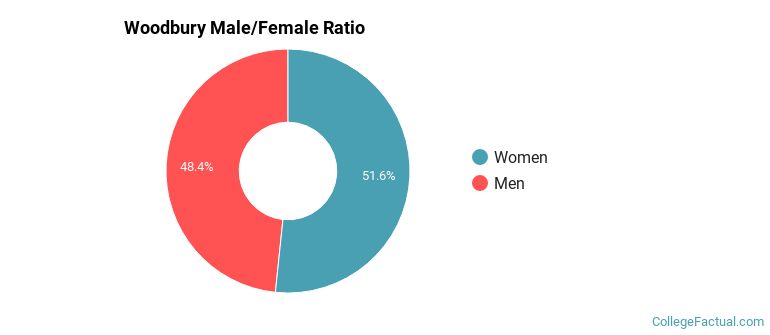
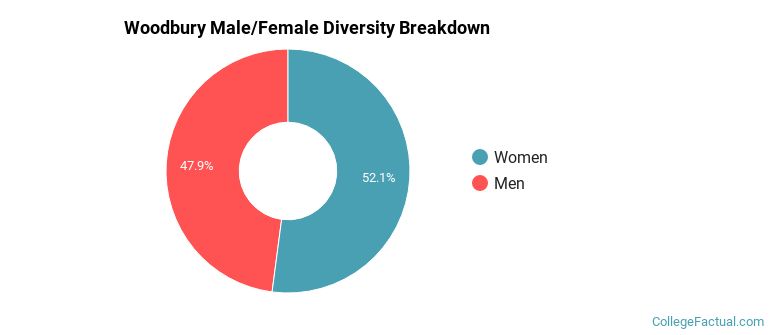
Male/Female Breakdown of Undergraduates
The full-time Woodbury undergraduate population is made up of 53% women, and 47% men.
For the gender breakdown for all students, go here.
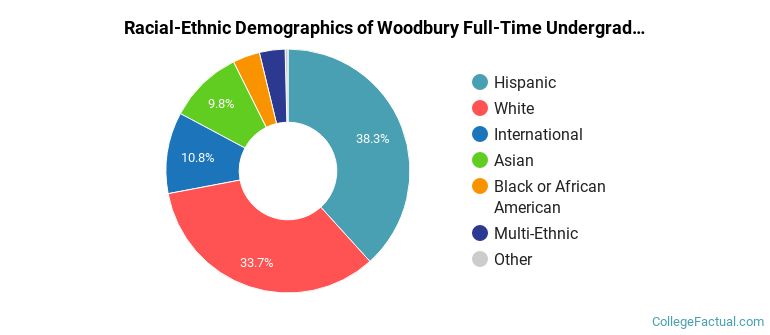
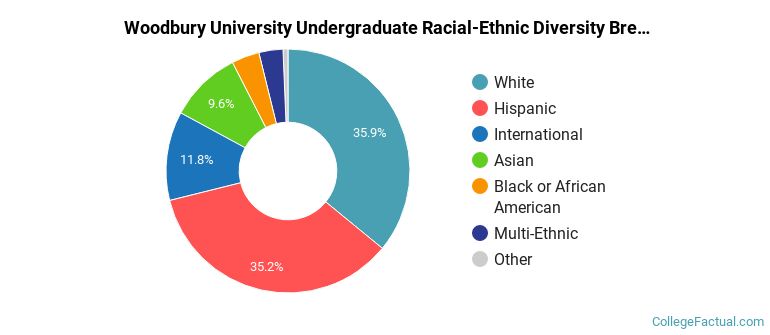
Woodbury Racial/Ethnic Breakdown of Undergraduates
| Race/Ethnicity | Number |
|---|---|
| Hispanic | 397 |
| White | 327 |
| Asian | 97 |
| International | 64 |
| Black or African American | 45 |
| Multi-Ethnic | 30 |
| Native Hawaiian or Pacific Islander | 2 |
| Unknown | 2 |
See racial/ethnic breakdown for all students.
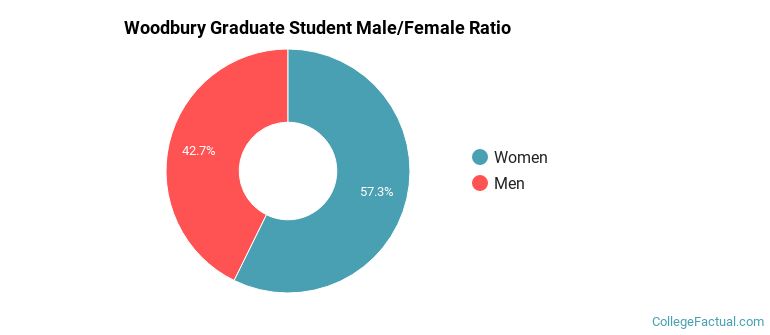
Male/Female Breakdown of Graduate Students
About 60% of full-time grad students are women, and 40% men.
For the gender breakdown for all students, go here.
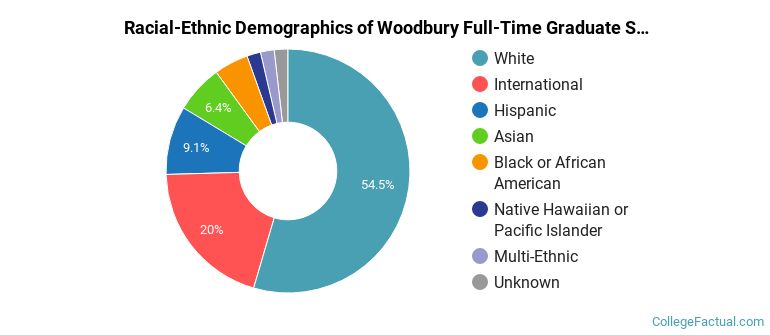
Woodbury Racial-Ethnic Breakdown of Graduate Students
| Race/Ethnicity | Number |
|---|---|
| White | 60 |
| International | 17 |
| Hispanic | 15 |
| Asian | 10 |
| Black or African American | 3 |
| Native Hawaiian or Pacific Islander | 1 |
| Multi-Ethnic | 0 |
| Unknown | 0 |
See racial/ethnic breakdown for all students.
| Race/Ethnicity | Number |
|---|---|
| Hispanic | 427 |
| White | 409 |
| Asian | 114 |
| International | 91 |
| Black or African American | 51 |
| Multi-Ethnic | 33 |
| Native Hawaiian or Pacific Islander | 3 |
| Unknown | 2 |
There are approximately 605 female students and 527 male students at Woodbury.
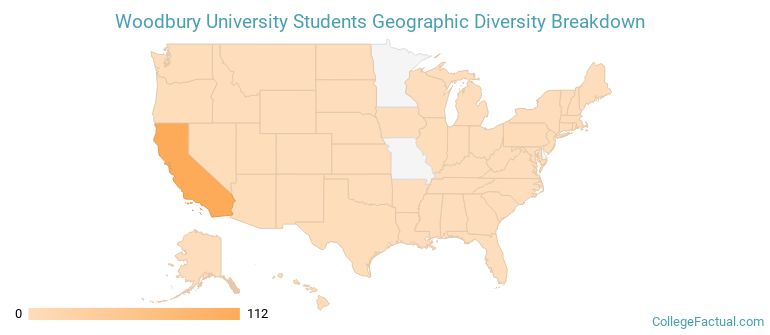
Woodbury ranks 1,091 out of 2,183 when it comes to geographic diversity.
13.18% of Woodbury students come from out of state, and 5.84% come from out of the country.
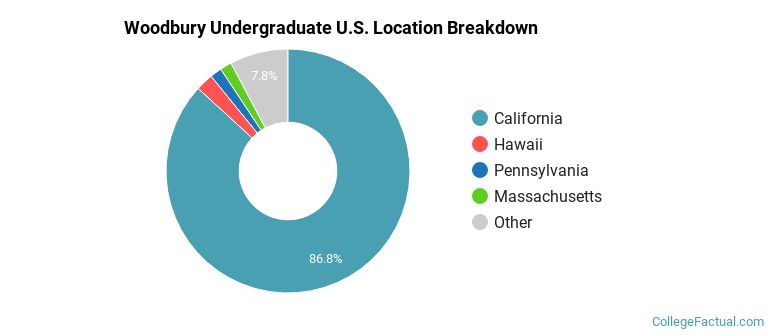
The undergraduate student body is split among 14 states (may include Washington D.C.). Click on the map for more detail.
| State | Amount |
|---|---|
| California | 112 |
| Hawaii | 3 |
| Massachusetts | 2 |
| Pennsylvania | 2 |
| Arizona | 1 |
Students from 44 countries are represented at this school, with the majority of the international students coming from Saudi Arabia, China, and Russia.
Learn more about international students at Woodbury.
A traditional college student is defined as being between the ages of 18-21. At Woodbury, 39.40% of students fall into that category, compared to the national average of 60%.
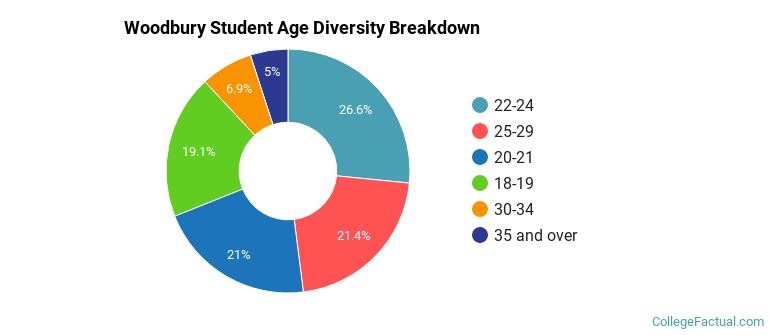
| Student Age Group | Amount |
|---|---|
| 22-24 | 303 |
| 25-29 | 244 |
| 20-21 | 239 |
| 18-19 | 218 |
| 30-34 | 79 |
| 35 and over | 57 |
| Under 18 | 0 |
Footnotes
*The racial-ethnic minorities count is calculated by taking the total number of students and subtracting white students, international students, and students whose race/ethnicity was unknown. This number is then divided by the total number of students at the school to obtain the racial-ethnic minorities percentage.
References
Department of Homeland Security Citizenship and Immigration Services
Learn more about how College Factual creates their Diversity Rankings.