World Mission University total enrollment is approximately 370 students. 126 are undergraduates and 110 are graduate students.
Male/Female Breakdown of Undergraduates
The full-time World Mission University undergraduate population is made up of 76% women, and 24% men.
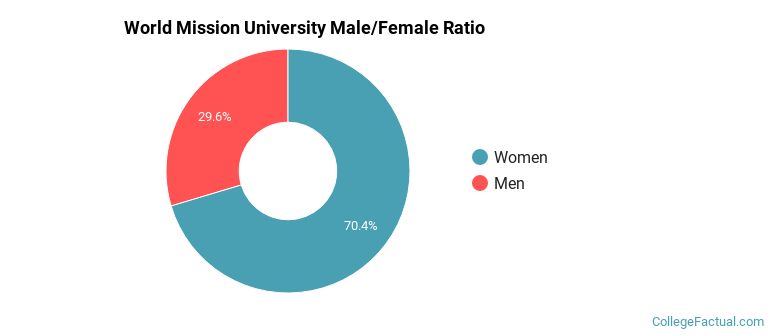
For the gender breakdown for all students, go here.
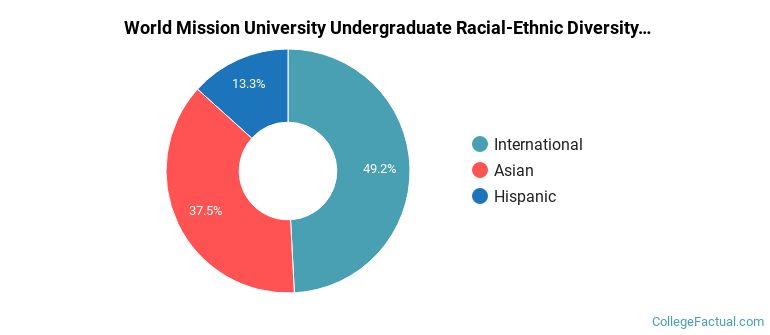
World Mission University Racial/Ethnic Breakdown of Undergraduates

| Race/Ethnicity | Number |
|---|---|
| Asian | 58 |
| Hispanic | 39 |
| International | 28 |
| Unknown | 1 |
| Black or African American | 0 |
| White | 0 |
| Native Hawaiian or Pacific Islander | 0 |
| Multi-Ethnic | 0 |
See racial/ethnic breakdown for all students.
Male/Female Breakdown of Graduate Students
About 55% of full-time grad students are women, and 45% men.
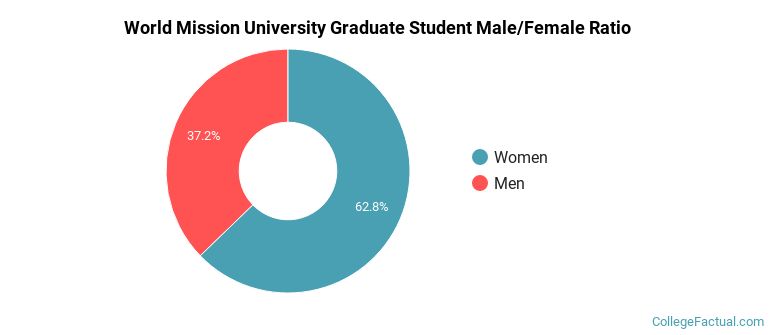
For the gender breakdown for all students, go here.
World Mission University Racial-Ethnic Breakdown of Graduate Students

| Race/Ethnicity | Number |
|---|---|
| International | 84 |
| Asian | 26 |
| Black or African American | 0 |
| Hispanic | 0 |
| White | 0 |
| Native Hawaiian or Pacific Islander | 0 |
| Multi-Ethnic | 0 |
| Unknown | 0 |
See racial/ethnic breakdown for all students.
| Race/Ethnicity | Number |
|---|---|
| International | 164 |
| Asian | 161 |
| Hispanic | 43 |
| Unknown | 2 |
| Black or African American | 0 |
| White | 0 |
| Native Hawaiian or Pacific Islander | 0 |
| Multi-Ethnic | 0 |

There are approximately 258 female students and 112 male students at World Mission University.
World Mission University ranks 1,070 out of 2,183 when it comes to geographic diversity.
28.57% of World Mission University students come from out of state, and 0% come from out of the country.
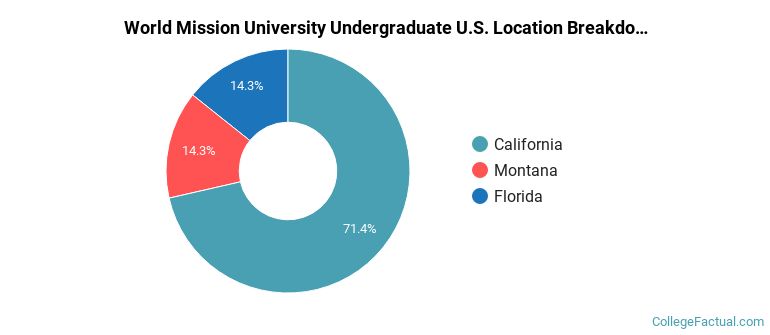
The undergraduate student body is split among 3 states (may include Washington D.C.). Click on the map for more detail.
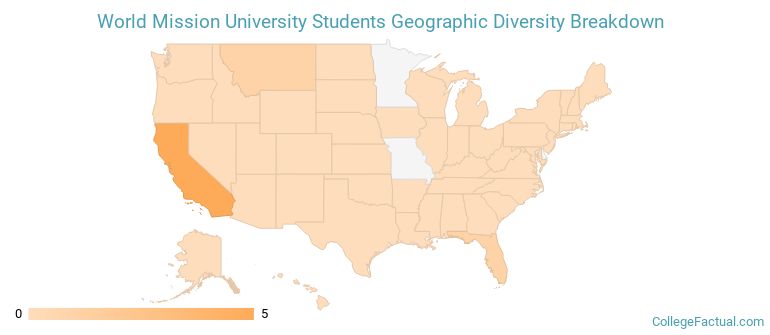
| State | Amount |
|---|---|
| California | 5 |
| Florida | 1 |
| Montana | 1 |
| Alaska | 0 |
| Alabama | 0 |
Students from 3 countries are represented at this school, with the majority of the international students coming from South Korea, Canada, and China.
Learn more about international students at World Mission University.
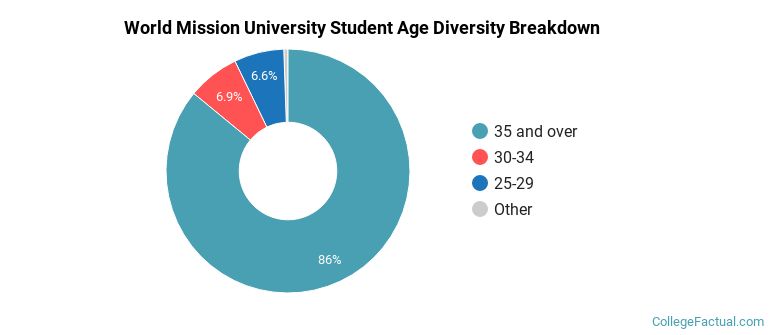
| Student Age Group | Amount |
|---|---|
| 35 and over | 312 |
| 30-34 | 25 |
| 25-29 | 24 |
| 22-24 | 2 |
| 18-19 | 0 |
| 20-21 | 0 |
| Under 18 | 0 |
Footnotes
*The racial-ethnic minorities count is calculated by taking the total number of students and subtracting white students, international students, and students whose race/ethnicity was unknown. This number is then divided by the total number of students at the school to obtain the racial-ethnic minorities percentage.
References
Department of Homeland Security Citizenship and Immigration Services
Image Credit: By Scientist-100 under License