
College Factual analyzes over 2,000 colleges and universities in its annual rankings and ranks them in a variety of ways, including most diverse, best overall quality, best for non-traditional students, and much more.
Yakima Valley College was awarded 23 badges in the 2025 rankings. The highest ranked major at the school is substance abuse/addiction counseling.
Explore the best ranked schools for the programs you are most interested in.
College Factual ranked YVC as #1,581 out of 2,152 colleges and universities in the country on its 2025 Best Colleges list. This is an improvement over the previous year, when YVC held the #1,741 spot on the Best Overall Colleges list.
Out of the 50 colleges in Washington, YVC is ranked at #37.
If you are worried about getting into Yakima Valley College, don't be. The school has a liberal open admissions policy, which means you only need to meet basic requirements in order to be admitted. Still, be sure to submit a complete application and provide any other requested materials.
The student to faculty ratio at Yakima Valley College is about average at 15 to 1. This ratio is often used to gauge how many students might be in an average class and how much time professors will have to spend with their students on an individual level. The national average for this metric is 15 to 1.
Another measure that is often used to estimate how much access students will have to their professors is how many faculty members are full-time. The idea here is that part-time faculty tend to spend less time on campus, so they may not be as available to students as full-timers.
The full-time faculty percentage at Yakima Valley College is 100%. This is higher than the national average of 47%.
During the 2017-2018 academic year, there were 3,954 undergraduates at YVC with 2,701 being full-time and 1,253 being part-time.
| $0-30 K | $30K-48K | $48-75 | $75-110K | $110K + |
|---|---|---|---|---|
| $7,940 | $8,576 | $9,577 | $14,292 | $15,502 |
The net price is calculated by adding tuition, room, board and other costs and subtracting financial aid.Note that the net price is typically less than the published for a school. For more information on the sticker price of YVC, see our tuition and fees and room and board pages.
It's not uncommon for college students to take out loans to pay for school. In fact, almost 66% of students nationwide depend at least partially on loans. At YVC, approximately 6% of students took out student loans averaging $6,352 a year. That adds up to $25,408 over four years for those students.
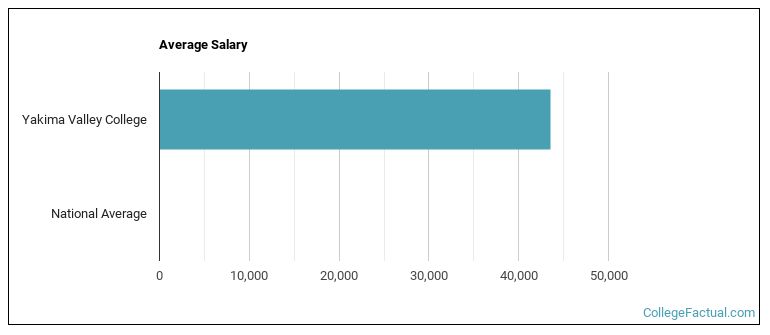
See which majors at Yakima Valley College make the most money.
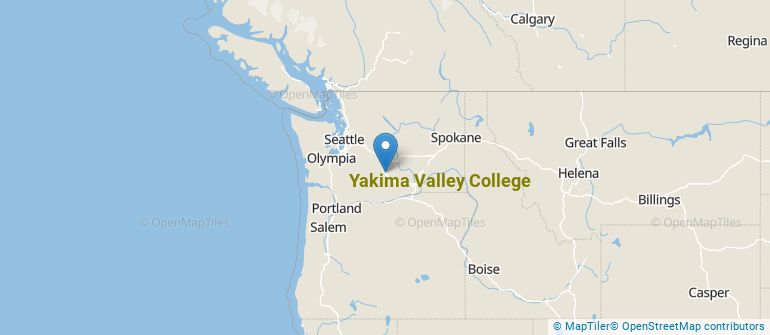
Get more details about the location of Yakima Valley College.
Contact details for YVC are given below.
| Contact Details | |
|---|---|
| Address: | South 16Th Ave. & Nob Hill Blvd., Yakima, WA 98907-2520 |
| Phone: | 509-574-4600 |
| Website: | https://www.yvcc.edu/ |
| Most Popular Majors | Bachelor’s Degrees | Average Salary of Graduates |
|---|---|---|
| Liberal Arts General Studies | 427 | NA |
| Health & Medical Administrative Services | 198 | NA |
| Teacher Education Grade Specific | 114 | NA |
| Nursing | 56 | NA |
| Business Administration & Management | 45 | $44,370 |
| Allied Health & Medical Assisting Services | 34 | NA |
| General Business/Commerce | 30 | NA |
| Clinical/Medical Laboratory Science | 30 | NA |
| Allied Health Professions | 26 | NA |
| Criminal Justice & Corrections | 23 | NA |
Online learning is becoming popular at even the oldest colleges and universities in the United States. Not only are online classes great for returning adults with busy schedules, they are also frequented by a growing number of traditional students.
In 2022-2023, 2,165 students took at least one online class at Yakima Valley College. This is a decrease from the 3,592 students who took online classes the previous year.
| Year | Took at Least One Online Class | Took All Classes Online |
|---|---|---|
| 2022-2023 | 2,165 | 1,172 |
| 2021-2022 | 3,592 | 3,146 |
| 2020-2021 | 3,910 | 3,700 |
| 2018-2019 | 1,911 | 638 |
Footnotes
*The racial-ethnic minorities count is calculated by taking the total number of students and subtracting white students, international students, and students whose race/ethnicity was unknown. This number is then divided by the total number of students at the school to obtain the racial-ethnic minorities percentage.
References
More about our data sources and methodologies.