We've pulled together some essential information you should know about the program, including how many students graduate each year, the ethnic diversity of these students, and more. In addition, we cover how Yale ranks in comparison to other schools with music programs.
Jump to any of the following sections:
Learn about start dates, transferring credits, availability of financial aid, and more by contacting the universities below.
Earn the music business degree that fits into the business world – and partners Southern New Hampshire University with world-renowned Berklee College of Music.
The music major at Yale is not ranked on College Factual’s Best Colleges and Universities for Music. This could be for a number of reasons, such as not having enough data on the major or school to make an accurate assessment of its quality.
During the 2021-2022 academic year, Yale University handed out 11 bachelor's degrees in music. This is an increase of 38% over the previous year when 8 degrees were handed out.
In 2022, 121 students received their master’s degree in music from Yale. This makes it the #6 most popular school for music master’s degree candidates in the country.
In addition, 9 students received their doctoral degrees in music in 2022, making the school the #46 most popular school in the United States for this category of students.
The average full-time tuition and fees for undergraduates are shown in the table below.
| In State | Out of State | |
|---|---|---|
| Tuition | $64,700 | $64,700 |
| Books and Supplies | $1,000 | $1,000 |
| On Campus Room and Board | $19,180 | $19,180 |
| On Campus Other Expenses | $3,420 | $3,420 |
Learn more about Yale tuition and fees.
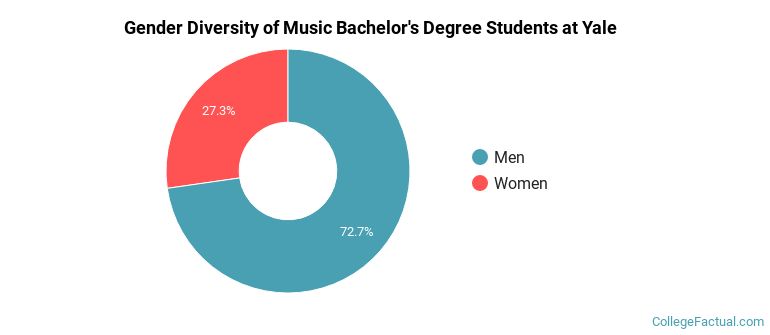
Of the 11 music students who graduated with a bachelor's degree in 2021-2022 from Yale, about 73% were men and 27% were women.
The majority of bachelor's degree recipients in this major at Yale are white. In the most recent graduating class for which data is available, 55% of students fell into this category.
The following table and chart show the ethnic background for students who recently graduated from Yale University with a bachelor's in music.
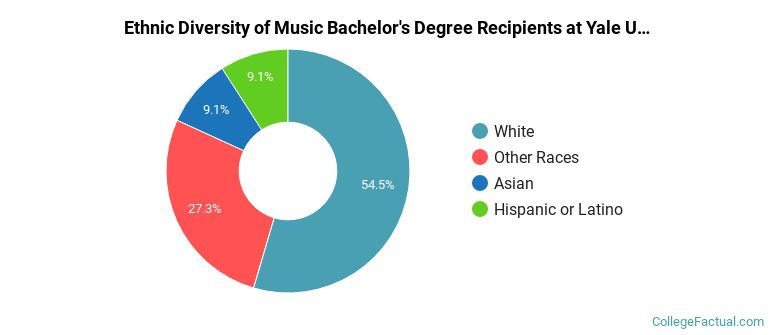
| Ethnic Background | Number of Students |
|---|---|
| Asian | 1 |
| Black or African American | 0 |
| Hispanic or Latino | 1 |
| White | 6 |
| Non-Resident Aliens | 0 |
| Other Races | 3 |
Online degrees for the Yale music bachelor’s degree program are not available at this time. To see if the school offers distance learning options in other areas, visit the Yale Online Learning page.
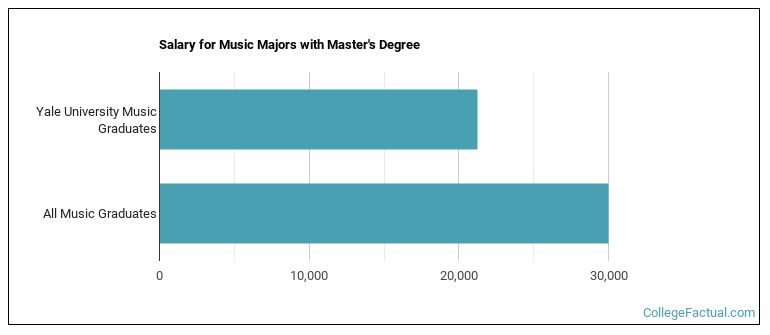
Graduates of the master's music program at Yale make a median salary of $21,250. This is less than what their typical peers from other schools make. Their median salary is $29,974.
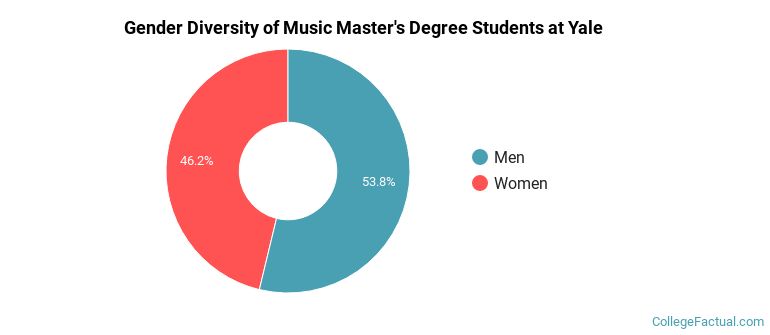
Of the 106 students who earned a master's degree in Music from Yale in 2021-2022, 54% were men and 46% were women.
The following table and chart show the ethnic background for students who recently graduated from Yale University with a master's in music.
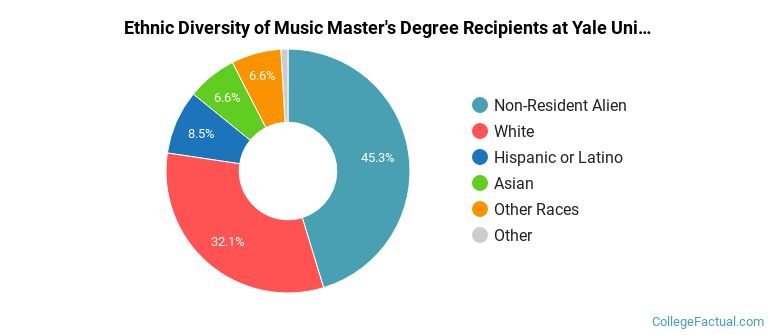
| Ethnic Background | Number of Students |
|---|---|
| Asian | 7 |
| Black or African American | 1 |
| Hispanic or Latino | 9 |
| White | 34 |
| Non-Resident Aliens | 48 |
| Other Races | 7 |
Take a look at the following statistics related to the make-up of the music majors at Yale University.
| Related Major | Annual Graduates |
|---|---|
| Fine & Studio Arts | 95 |
| Drama & Theater Arts | 58 |
| Film, Video & Photographic Arts | 34 |
| Design & Applied Arts | 15 |
| General Visual & Performing Arts | 5 |
More about our data sources and methodologies.
