Yale total enrollment is approximately 12,060 students. 4,696 are undergraduates and 7,209 are graduate students.
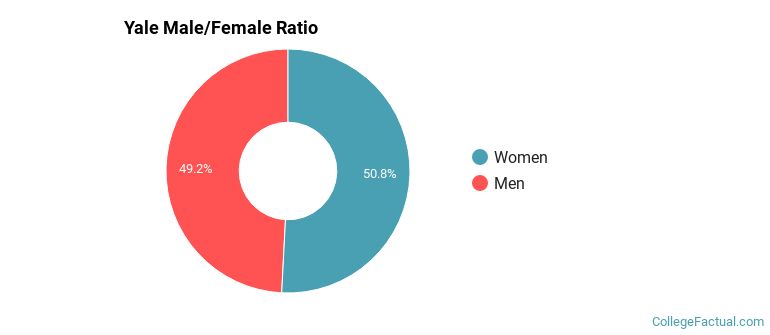
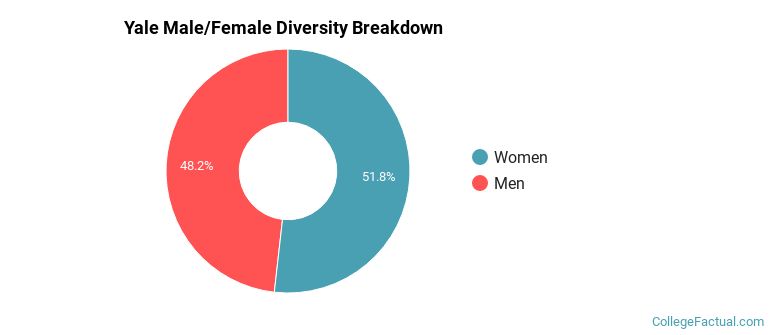
Male/Female Breakdown of Undergraduates
The full-time Yale undergraduate population is made up of 50% women, and 50% men.
For the gender breakdown for all students, go here.
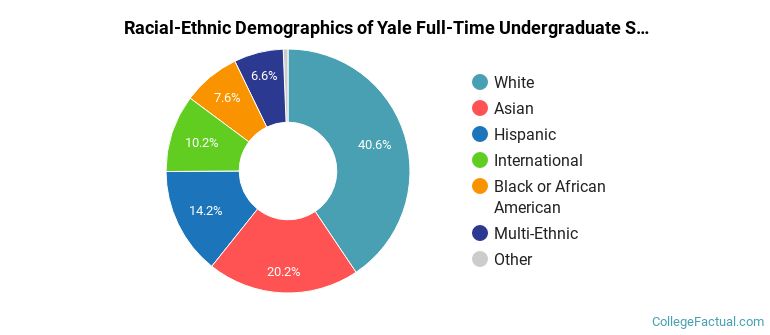
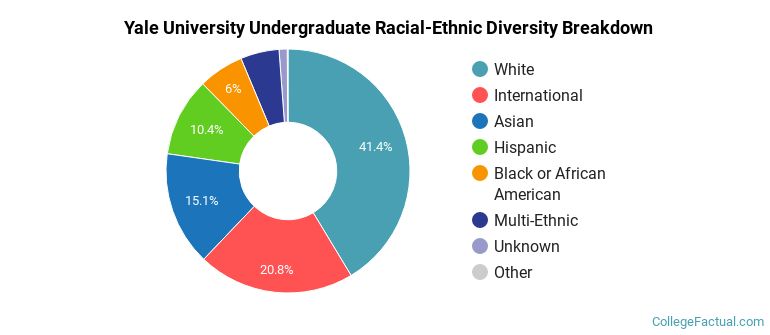
Yale Racial/Ethnic Breakdown of Undergraduates
| Race/Ethnicity | Number |
|---|---|
| White | 1,639 |
| Asian | 1,123 |
| Hispanic | 707 |
| International | 472 |
| Black or African American | 427 |
| Multi-Ethnic | 292 |
| Unknown | 18 |
| Native Hawaiian or Pacific Islander | 5 |
See racial/ethnic breakdown for all students.
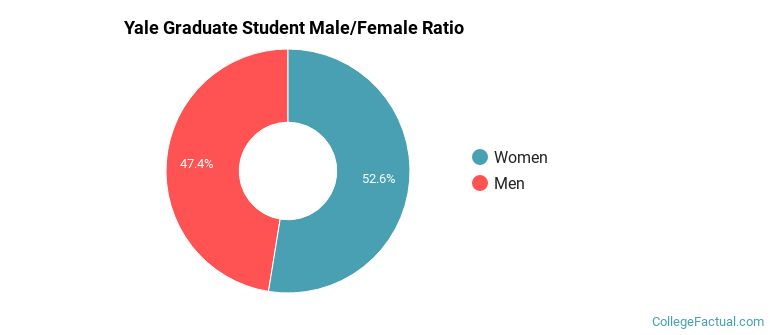
Male/Female Breakdown of Graduate Students
About 52% of full-time grad students are women, and 48% men.
For the gender breakdown for all students, go here.
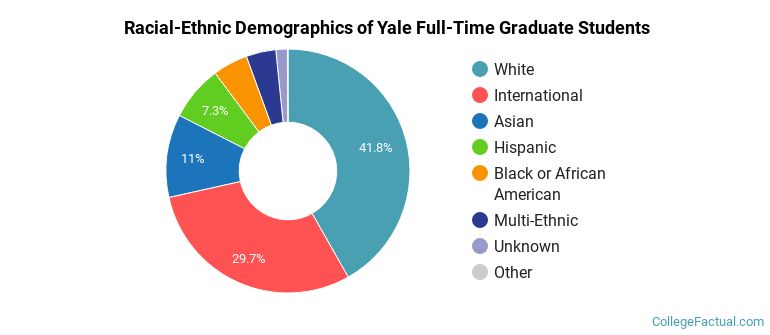
Yale Racial-Ethnic Breakdown of Graduate Students
| Race/Ethnicity | Number |
|---|---|
| White | 2,946 |
| International | 2,060 |
| Asian | 820 |
| Hispanic | 561 |
| Black or African American | 352 |
| Multi-Ethnic | 294 |
| Unknown | 152 |
| Native Hawaiian or Pacific Islander | 7 |
See racial/ethnic breakdown for all students.
| Race/Ethnicity | Number |
|---|---|
| White | 4,673 |
| International | 2,546 |
| Asian | 1,959 |
| Hispanic | 1,281 |
| Black or African American | 788 |
| Multi-Ethnic | 593 |
| Unknown | 175 |
| Native Hawaiian or Pacific Islander | 15 |
There are approximately 6,221 female students and 5,839 male students at Yale.
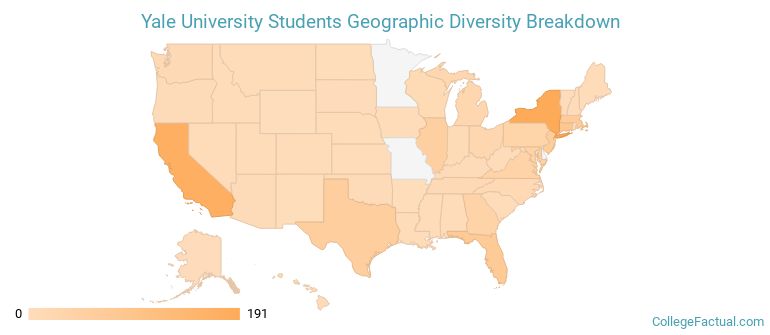
Yale ranks 5 out of 2,183 when it comes to geographic diversity.
93% of Yale students come from out of state, and 12.87% come from out of the country.
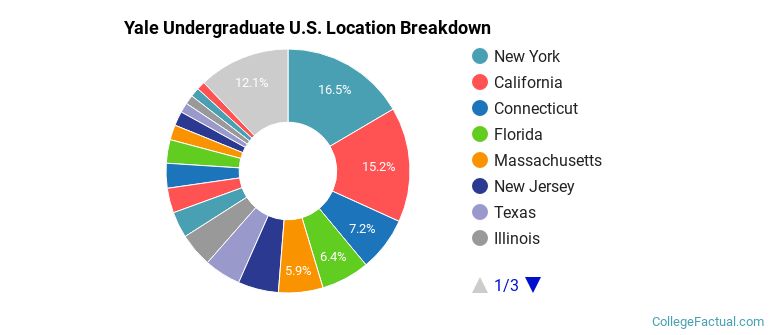
The undergraduate student body is split among 48 states (may include Washington D.C.). Click on the map for more detail.
| State | Amount |
|---|---|
| New York | 191 |
| California | 176 |
| Connecticut | 83 |
| Florida | 74 |
| Massachusetts | 68 |
Students from 127 countries are represented at this school, with the majority of the international students coming from China, Canada, and India.
Learn more about international students at Yale.
A traditional college student is defined as being between the ages of 18-21. At Yale, 41.13% of students fall into that category, compared to the national average of 60%.
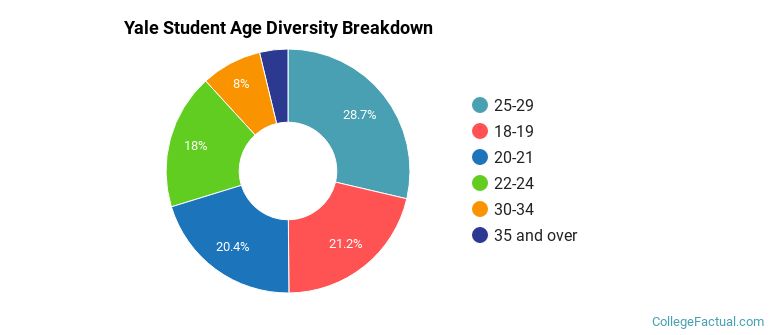
| Student Age Group | Amount |
|---|---|
| 25-29 | 3,676 |
| 18-19 | 2,723 |
| 20-21 | 2,613 |
| 22-24 | 2,303 |
| 30-34 | 1,031 |
| 35 and over | 482 |
| Under 18 | 0 |
Footnotes
*The racial-ethnic minorities count is calculated by taking the total number of students and subtracting white students, international students, and students whose race/ethnicity was unknown. This number is then divided by the total number of students at the school to obtain the racial-ethnic minorities percentage.
References
Department of Homeland Security Citizenship and Immigration Services
Learn more about how College Factual creates their Diversity Rankings.