Explore the best ranked schools for the programs you are most interested in.
Yeshiva Toras Chaim was not ranked in College Factual's Best Overall Colleges report this year. This may be because not enough data was available.
Yeshiva Toras Chaim has an acceptance rate of 59%, which means the school is serious about who it admits. Take your time in putting together a strong application that highlights why you are a good fit for Yeshiva Toras Chaim.
The student to faculty ratio is often used as a measure to gauge how much access students will have to their professors - the lower the number, the better. At Yeshiva Toras Chaim, this rate is 21 to 1, which is high when compared to the national average of 15 to 1.
The freshmen retention rate of 94% tells us that most first-year, full-time students like Yeshiva Toras Chaim enough to come back for another year. This is a fair bit higher than the national average of 68%. That's certainly something to check off in the good column about the school.
During the 2017-2018 academic year, there were 218 full-time undergraduates at Yeshiva Toras Chaim.
| $0-30 K | $30K-48K | $48-75 | $75-110K | $110K + |
|---|---|---|---|---|
| $4,849 | $7,165 | $4,085 | $9,247 | $6,294 |
The net price is calculated by adding tuition, room, board and other costs and subtracting financial aid.Note that the net price is typically less than the published for a school. For more information on the sticker price of Yeshiva Toras Chaim, see our tuition and fees and room and board pages.
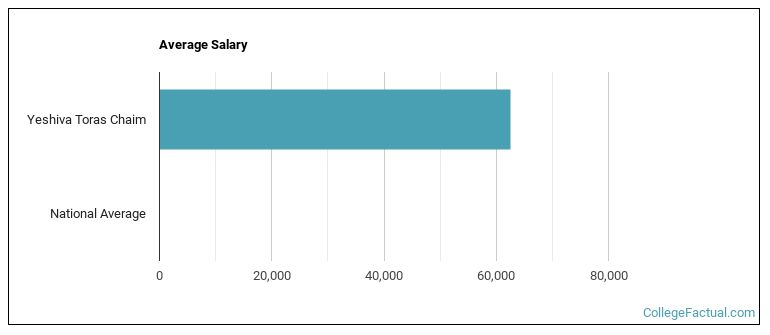
See which majors at Yeshiva Toras Chaim make the most money.
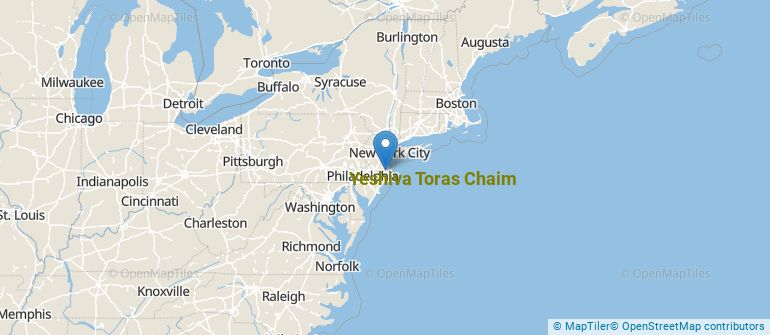
Get more details about the location of Yeshiva Toras Chaim.
Contact details for Yeshiva Toras Chaim are given below.
| Contact Details | |
|---|---|
| Address: | 999 Ridge Ave, Lakewood, NJ 08701 |
| Phone: | 732-414-2834 |
| Website: | https://ytclakewood.com/ |
| Most Popular Majors | Bachelor’s Degrees | Average Salary of Graduates |
|---|---|---|
| Religious Studies | 28 | NA |
Footnotes
*The racial-ethnic minorities count is calculated by taking the total number of students and subtracting white students, international students, and students whose race/ethnicity was unknown. This number is then divided by the total number of students at the school to obtain the racial-ethnic minorities percentage.
References
More about our data sources and methodologies.