Here, you'll find out more about the major, including such details as the number of graduates, what degree levels are offered, ethnicity of students, average salaries, and more. In addition, we cover how Youngstown State University ranks in comparison to other schools with subject specific ed programs.
Go directly to any of the following sections:
The bachelor's program at Youngstown State University was ranked #93 on College Factual's Best Schools for subject specific ed list. It is also ranked #4 in Ohio.
| Ranking Type | Rank |
|---|---|
| Best Teacher Education Subject Specific Schools | 93 |
| Best Teacher Education Subject Specific Bachelor’s Degree Schools | 95 |
During the 2021-2022 academic year, Youngstown State University handed out 41 bachelor's degrees in teacher education subject specific. This is a decrease of 25% over the previous year when 55 degrees were handed out.
In 2022, 7 students received their master’s degree in subject specific ed from Youngstown State University. This makes it the #373 most popular school for subject specific ed master’s degree candidates in the country.
Subject Specific Ed majors who earn their bachelor's degree from Youngstown State University go on to jobs where they make a median salary of $33,398 a year. Unfortunately, this is lower than the national average of $43,086 for all subject specific ed students.

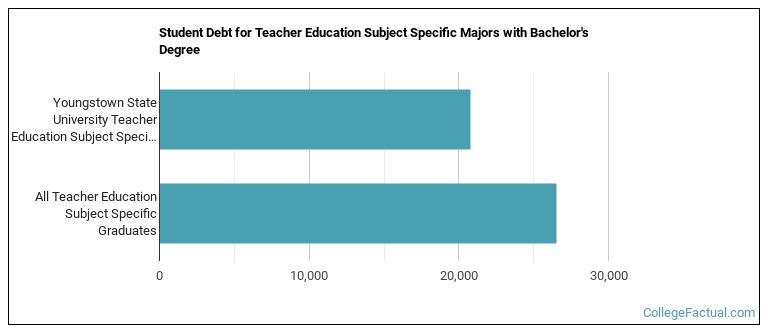
While getting their bachelor's degree at Youngstown State University, subject specific ed students borrow a median amount of $20,793 in student loans. This is not too bad considering that the median debt load of all subject specific ed bachelor's degree recipients across the country is $26,530.
The typical student loan payment of a bachelor's degree student from the subject specific ed program at Youngstown State University is $180 per month.
In 2022-2023, the average part-time undergraduate tuition at Youngstown State University was $417 per credit hour for out-of-state students. The average for in-state students was $402 per credit hour. The following table shows the average full-time tuition and fees for undergraduates.
| In State | Out of State | |
|---|---|---|
| Tuition | $9,611 | $9,971 |
| Fees | $146 | $146 |
| Books and Supplies | $1,200 | $1,200 |
| On Campus Room and Board | $10,384 | $10,384 |
| On Campus Other Expenses | $4,024 | $4,024 |
Learn more about Youngstown State University tuition and fees.
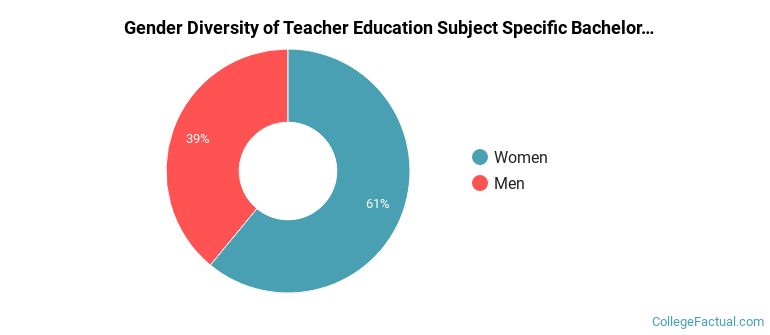
Of the 41 students who graduated with a Bachelor’s in subject specific ed from Youngstown State University in 2022, 39% were men and 61% were women.
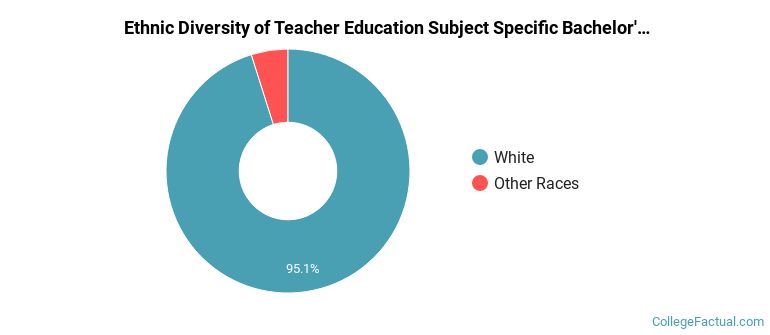
The majority of bachelor's degree recipients in this major at Youngstown State University are white. In the most recent graduating class for which data is available, 95% of students fell into this category.
The following table and chart show the ethnic background for students who recently graduated from Youngstown State University with a bachelor's in subject specific ed.
| Ethnic Background | Number of Students |
|---|---|
| Asian | 0 |
| Black or African American | 0 |
| Hispanic or Latino | 0 |
| White | 39 |
| Non-Resident Aliens | 0 |
| Other Races | 2 |
Youngstown State University does not offer an online option for its subject specific ed bachelor’s degree program at this time. To see if the school offers distance learning options in other areas, visit the Youngstown State University Online Learning page.
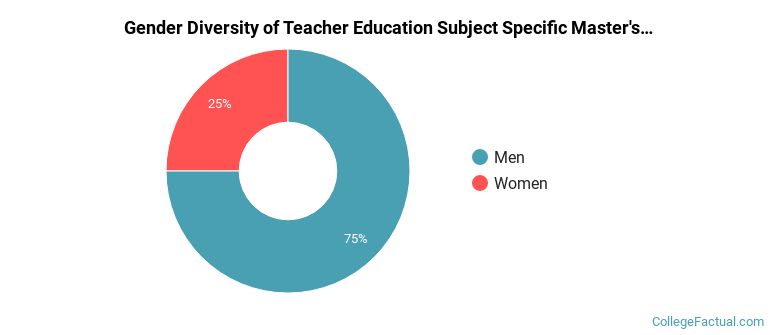
Of the 4 subject specific ed students who graduated with a master's degree in 2021-2022 from Youngstown State University, about 75% were men and 25% were women.
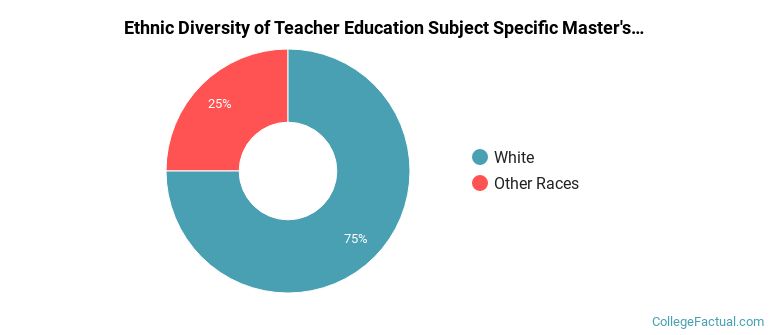
The majority of the students with this major are white. About 75% of 2022 graduates were in this category.
The following table and chart show the ethnic background for students who recently graduated from Youngstown State University with a master's in subject specific ed.
| Ethnic Background | Number of Students |
|---|---|
| Asian | 0 |
| Black or African American | 0 |
| Hispanic or Latino | 0 |
| White | 3 |
| Non-Resident Aliens | 0 |
| Other Races | 1 |
Take a look at the following statistics related to the make-up of the subject specific ed majors at Youngstown State University.
| Related Major | Annual Graduates |
|---|---|
| Special Education | 73 |
| Educational Administration | 59 |
| Curriculum & Instruction | 56 |
| Teacher Education Grade Specific | 45 |
| Student Counseling | 35 |
View All Teacher Education Subject Specific Related Majors >
More about our data sources and methodologies.