 by our College Data Analytics Team
Here is an overview of the graduate program in psychology at American University. It is offered at the Master’s, Doctoral levels, with undergraduate study also available. Its best result is a rank of #2 out of 5 schools (Master’s level) by College Factual. Jump to any of the following sections:
By College Factual’s measure, American University as a strong choice for psychology, coming in at #260 out of 1,523 schools nationally.
| Ranking | Rank |
|---|---|
| Best Psychology Schools | 260 of 1,523 |
| Best Psychology Schools in District of Columbia | 3 of 9 |
| Best Psychology Schools in the Middle Atlantic Region | 63 of 273 |
The following degree levels are granted in psychology at American University, along with how many graduates complete each level annually.
| Degree Level | Annual Graduates |
|---|---|
| Bachelor’s | 85 |
| Master’s | 24 |
| Doctoral | 2 |
The psychology area of study at American University covers the following majors. Choose a major for its full rankings, popularity, and outcomes:
| Major | Annual Graduates |
|---|---|
| Psychology, General | 109 |
| Clinical, Counseling and Applied Psychology | 2 |
During the most recent reporting year, American University conferred 24 master’s degrees in psychology.
American University is a solid choice among schools offering psychology at the master’s level. Its best result was #2 out of 5 schools by College Factual.
| Ranking | Rank |
|---|---|
| Best Psychology Master’s Degree Schools in District of Columbia | 2 |
| Best Psychology Master’s Degree Schools in the Middle Atlantic Region | 30 |
| Best Psychology Master’s Degree Schools | 111 |
Average full-time graduate tuition and fees are listed in the table below.
| In State | Out of State | |
|---|---|---|
| Tuition | $64,414 | $64,414 |
| Fees | $1,152 | $1,152 |
Learn more about American University tuition and fees.
In the most recent graduating class, 17% of psychology master’s degrees went to men and 83% went to women.
 The largest share of psychology master’s degree graduates at American University were White. About 54% of graduates fell into this category.
The following table and chart show the ethnic background for students who recently graduated from American University with a master’s in psychology.
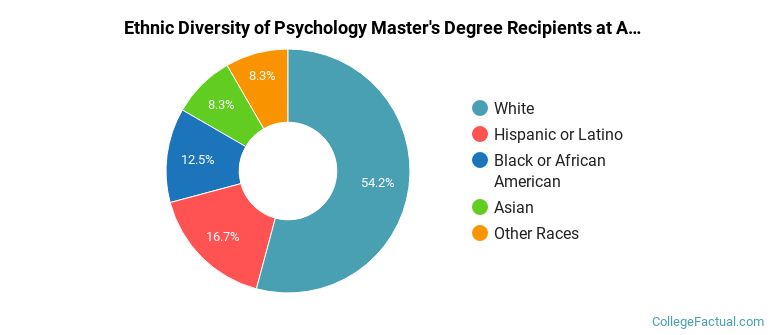
| Ethnic Background | Number of Students |
|---|---|
| Asian | 2 |
| Black or African American | 3 |
| Hispanic or Latino | 4 |
| White | 13 |
| Non-Resident Aliens | 0 |
| Other Races | 2 |
For the most recent IPEDS reporting year, American University conferred 2 doctoral degrees in psychology.
American University is not currently ranked for psychology at the doctoral level.
Every one of the 2 students who graduated with a doctoral degree in psychology from American University identified as women.
 The largest share of psychology doctoral degree graduates at American University were White. About 100% of graduates fell into this category.
The following table and chart show the ethnic background for students who recently graduated from American University with a doctoral in psychology.

| Ethnic Background | Number of Students |
|---|---|
| Asian | 0 |
| Black or African American | 0 |
| Hispanic or Latino | 0 |
| White | 2 |
| Non-Resident Aliens | 0 |
| Other Races | 0 |
Undergraduate study is also available at American University. Annual undergraduate completions by level are shown below.
| Undergraduate Level | Annual Graduates |
|---|---|
| Bachelor’s Degrees in Psychology | 85 |