Mining & Mineral Engineering is a concentration offered under the mining engineering major at Colorado School of Mines. We’ve pulled together some essential information you should know about the doctor’s degree program in mining and mineral engineering, including how many students graduate each year, the ethnic diversity of these students, and more.
If there’s something special you’re looking for, you can use one of the links below to find it:
In 2019-2020, the average part-time graduate tuition at Mines was $2,075 per credit hour for out-of-state students. The average for in-state students was $925 per credit hour. The average full-time tuition and fees for graduate students are shown in the table below.
| In State | Out of State | |
|---|---|---|
| Tuition | $16,650 | $37,350 |
| Fees | $2,450 | $2,450 |
Mines does not offer an online option for its mining and mineral engineering doctor’s degree program at this time. To see if the school offers distance learning options in other areas, visit the Mines Online Learning page.
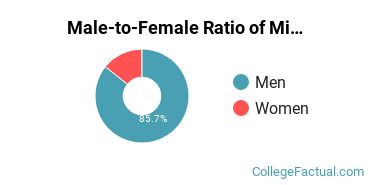
Of the students who received their doctor’s degree in mining and mineral engineering in 2019-2020, 14.3% of them were women. This is about the same as the countrywide number of 13.6%.
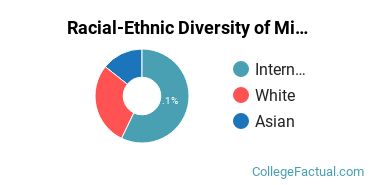
Around 14.3% of mining and mineral engineering doctor’s degree recipients at Mines in 2019-2020 were awarded to racial-ethnic minorities*. This is higher than the nationwide number of 9%.
| Race/Ethnicity | Number of Students |
|---|---|
| Asian | 1 |
| Black or African American | 0 |
| Hispanic or Latino | 0 |
| Native American or Alaska Native | 0 |
| Native Hawaiian or Pacific Islander | 0 |
| White | 2 |
| International Students | 4 |
| Other Races/Ethnicities | 0 |
*The racial-ethnic minorities count is calculated by taking the total number of students and subtracting white students, international students, and students whose race/ethnicity was unknown. This number is then divided by the total number of students at the school to obtain the racial-ethnic minorities percentage.
More about our data sources and methodologies.