 by our College Data Analytics Team
Below are the key facts about graduate study in political science & government at Cornell University. You can earn it at the Master’s, Doctoral levels, with undergraduate study also available. Jump to any of the following sections:
College Factual rates Cornell University as a strong choice for political science & government, coming in at #27 out of 681 schools nationally.
The following degree levels are offered in political science & government at Cornell University, along with how many graduates complete each level annually.
| Degree Level | Annual Graduates |
|---|---|
| Bachelor’s | 123 |
| Master’s | 8 |
| Doctoral | 7 |
During the most recent reporting year, Cornell University awarded 8 master’s degrees in political science & government.
Cornell University is not yet ranked for political science & government at the master’s level.
Average full-time graduate tuition and fees are listed in the table below.
| In State | Out of State | |
|---|---|---|
| Tuition | $81,306 | $81,306 |
| Fees | $660 | $660 |
Find out more about Cornell University tuition and fees.
In the most recent graduating class, 38% of political science & government master’s degrees went to men and 62% went to women.
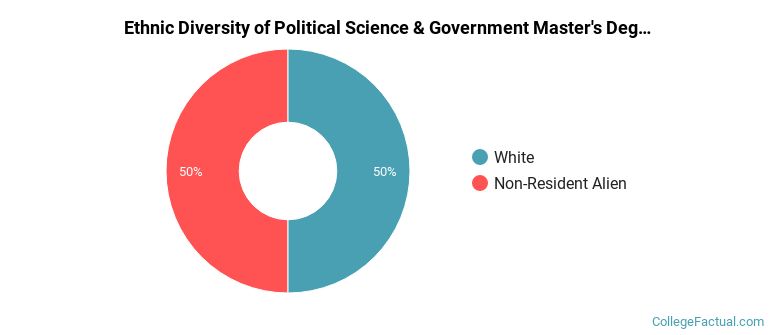
 The largest share of political science & government master’s degree graduates at Cornell University were White. Roughly 50% of graduates fell into this category.
The following table and chart show the ethnic background for students who recently graduated from Cornell University with a master’s in political science & government.
| Ethnic Background | Number of Students |
|---|---|
| Asian | 0 |
| Black or African American | 0 |
| Hispanic or Latino | 0 |
| White | 4 |
| Non-Resident Aliens | 4 |
| Other Races | 0 |
Cornell University conferred 8 master’s degrees in political science and government, general recently — 62% to women and 38% to men. The largest share of these graduates were White (50%).
For the most recent IPEDS reporting year, Cornell University conferred 7 doctoral degrees in political science & government.
Cornell University has not been ranked for political science & government at the doctoral level.
In the most recent graduating class, 57% of political science & government doctoral degrees went to men and 43% went to women.
 The largest share of political science & government doctoral degree graduates at Cornell University are Non-Resident Alien. Approximately 43% of graduates fell into this category.
The following table and chart show the ethnic background for students who recently graduated from Cornell University with a doctoral in political science & government.

| Ethnic Background | Number of Students |
|---|---|
| Asian | 0 |
| Black or African American | 1 |
| Hispanic or Latino | 0 |
| White | 2 |
| Non-Resident Aliens | 3 |
| Other Races | 1 |
Cornell University conferred 7 doctoral degrees in political science and government, general in the latest year of data — 43% to women and 57% to men. The most common background among these graduates was Non-Resident Alien (43%).
You can also study this field as an undergraduate at Cornell University. The following undergraduate award levels are reported.
| Undergraduate Level | Annual Graduates |
|---|---|
| Bachelor’s Degrees in Political Science & Government | 123 |