Here is an overview of the graduate program in educational administration at Hofstra University. You can earn it at the Master’s, Doctoral, Professional Certificate levels. Its best result is a rank of #10 out of 10 schools (Doctoral level) by College Factual. Jump to any of the following sections:
By College Factual’s measure, Hofstra University among the top schools in the country for educational administration, coming in at #359 out of 604 schools nationally.
| Ranking | Rank |
|---|---|
| Best Educational Administration Schools | 359 of 604 |
| Best Educational Administration Schools in New York | 34 of 41 |
| Best Educational Administration Schools in the Middle Atlantic Region | 88 of 102 |
Here is each degree level offered in educational administration at Hofstra University, along with how many graduates complete each level annually.
| Degree Level | Annual Graduates |
|---|---|
| Master’s | 7 |
| Doctoral | 12 |
| Professional Certificate | 3 |
During the most recent reporting year, Hofstra University awarded 7 master’s degrees in educational administration.
Hofstra University is not yet ranked for educational administration at the master’s level.
Information about average full-time graduate tuition and fees is shown in the table below.
| In State | Out of State | |
|---|---|---|
| Tuition | $70,870 | $70,870 |
| Fees | $716 | $716 |
Find out more about Hofstra University tuition and fees.
For the most recent academic year available, 29% of educational administration master’s degrees went to men and 71% went to women.
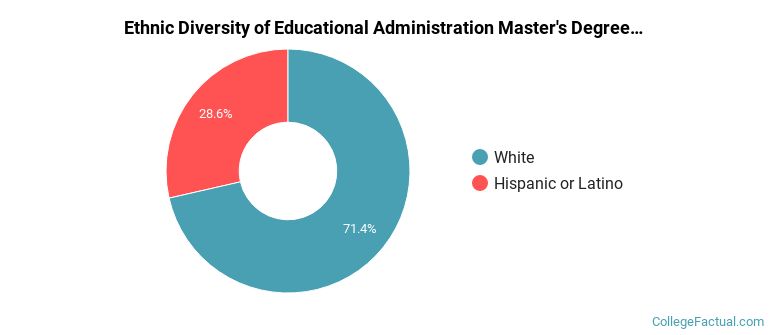
 The largest share of educational administration master’s degree graduates at Hofstra University are White. Roughly 71% of graduates fell into this category.
The following table and chart show the ethnic background for students who recently graduated from Hofstra University with a master’s in educational administration.
| Ethnic Background | Number of Students |
|---|---|
| Asian | 0 |
| Black or African American | 0 |
| Hispanic or Latino | 2 |
| White | 5 |
| Non-Resident Aliens | 0 |
| Other Races | 0 |
Hofstra University awarded 6 master’s degrees in higher education/higher education administration recently — 67% to women and 33% to men. Most of these graduates identified as White (83%).
Hofstra University granted 1 master’s completion in educational leadership and administration, general recently — 100% to women and 0% to men. The largest share of these graduates were Hispanic or Latino (100%).
In the most recent year for which we have data, Hofstra University handed out 12 doctoral degrees in educational administration.
Hofstra University ranks competitively among schools offering educational administration at the doctoral level. Specifically, it ranked #10 out of 10 schools by College Factual.
Among recent graduates, 33% of educational administration doctoral degrees went to men and 67% went to women.
 The majority of educational administration doctoral degree graduates at Hofstra University were White. About 50% of graduates fell into this category.
The following table and chart show the ethnic background for students who recently graduated from Hofstra University with a doctoral in educational administration.

| Ethnic Background | Number of Students |
|---|---|
| Asian | 0 |
| Black or African American | 3 |
| Hispanic or Latino | 1 |
| White | 6 |
| Non-Resident Aliens | 0 |
| Other Races | 2 |
Hofstra University conferred 12 doctoral completions in educational leadership and administration, general in the latest year of data — 67% to women and 33% to men. The largest share of these graduates were White (50%).
In the most recent year for which we have data, Hofstra University handed out 3 professional certificate degrees in educational administration.
Hofstra University has not been ranked for educational administration at the professional certificate level.
All of the 3 students who graduated with a professional certificate degree in educational administration from Hofstra University were women.
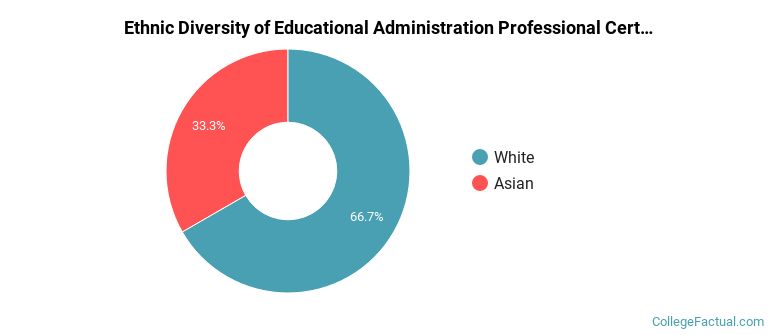
 The largest share of educational administration professional certificate degree graduates at Hofstra University were White. Approximately 67% of graduates fell into this category.
The following table and chart show the ethnic background for students who recently graduated from Hofstra University with a professional certificate in educational administration.
| Ethnic Background | Number of Students |
|---|---|
| Asian | 1 |
| Black or African American | 0 |
| Hispanic or Latino | 0 |
| White | 2 |
| Non-Resident Aliens | 0 |
| Other Races | 0 |
Hofstra University granted 3 professional certificate completions in educational leadership and administration, general in the latest year of data — 100% to women and 0% to men. The largest share of these graduates were White (67%).