The total graduate student population at Northeastern Seminary is made up of 49.5% women and 50.5% men. Note that these percentages may differ for certain degree programs.

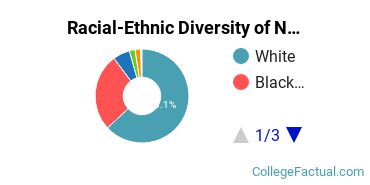
Of all the graduate students at Northeastern Seminary, around 35.0% belong to a racial-ethnic minority group. Americans aren't the only ones who appreciate the graduate programs at Northeastern Seminary. Around 1.9% of graduate students are international. The chart below shows the breakdown of graduate student demographics at the school. You can click on it for a more detailed view.
The average tuition and fees for graduate students is shown below.
| In-State | Out-of-State | |
|---|---|---|
| Tuition | $9,612 | $9,612 |
| Fees | $500 | $500 |
The average early-career salary for master's degree recipients from Northeastern Seminary is $46,741. When comparing to other master's degree holders, that's on the low side. It's about 20% lower than the national average of $58,425.

Get more details about the location of Northeastern Seminary.

Contact details for Northeastern Seminary are given below.
| Contact Details | |
|---|---|
| Address: | 2265 Westside Dr, Rochester, NY 14624 |
| Phone: | 585-594-6800 |
| Website: | www.nes.edu/ |
During the 2020-2021 academic year, 79.5% of the graduate students at Northeastern Seminary took at least one online course. Approximately 57.1% of grad students took all their classes online during that same time period.

The only degree programs listed here are those in which master’s degrees were awarded in 2020-2021.
| Master’s Degree Program | Annual Graduates |
|---|---|
| Theological & Ministerial Studies | 24 |
Just like the master’s degree programs, only programs that had doctorate degrees awarded in 2020-2021 are shown here.
| Doctorate Degree Program | Annual Graduates |
|---|---|
| Theological & Ministerial Studies | 4 |
Footnotes
*The racial-ethnic minorities count is calculated by taking the total number of students and subtracting white students, international students, and students whose race/ethnicity was unknown. This number is then divided by the total number of students at the school to obtain the racial-ethnic minorities percentage.
References
More about our data sources and methodologies.