Below are the key facts about graduate study in ethnic studies at Oregon State University. You can earn it at the Master’s, Doctoral levels, with undergraduate study also available. Jump to any of the following sections:
College Factual ranks Oregon State University among the top schools in the country for ethnic studies, placing at #34 out of 146 schools nationally.
| Ranking | Rank |
|---|---|
| Best Ethnic Studies Schools | 34 of 146 |
| Best Ethnic Studies Schools in Oregon | 1 of 4 |
The table below lists every degree level available for ethnic studies at Oregon State University, along with how many graduates complete each level annually.
| Degree Level | Annual Graduates |
|---|---|
| Bachelor’s | 14 |
| Master’s | 4 |
| Doctoral | 3 |
During the most recent reporting year, Oregon State University handed out 4 master’s degrees in ethnic studies.
Oregon State University is not yet ranked for ethnic studies at the master’s level.
Among recent graduates, 25% of ethnic studies master’s degrees went to men and 75% went to women.
 The majority of ethnic studies master’s degree graduates at Oregon State University were White. Approximately 50% of graduates fell into this category.
The following table and chart show the ethnic background for students who recently graduated from Oregon State University with a master’s in ethnic studies.
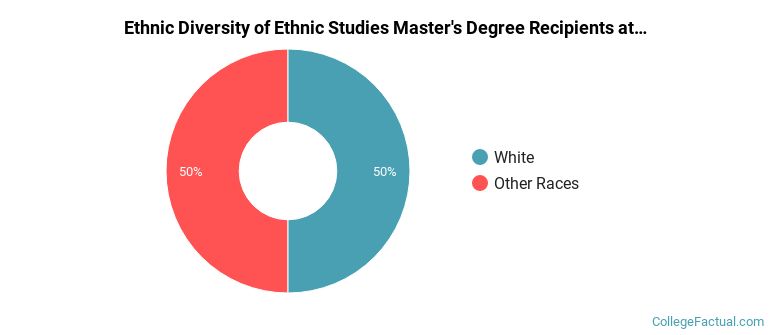
| Ethnic Background | Number of Students |
|---|---|
| Asian | 0 |
| Black or African American | 0 |
| Hispanic or Latino | 0 |
| White | 2 |
| Non-Resident Aliens | 0 |
| Other Races | 2 |
Oregon State University conferred 4 master’s degrees in women’s studies in the most recent reporting year — 75% to women and 25% to men. Most of these graduates identified as White (50%).
For the most recent IPEDS reporting year, Oregon State University conferred 3 doctoral degrees in ethnic studies.
Oregon State University is not currently ranked for ethnic studies at the doctoral level.
For the most recent academic year available, 33% of ethnic studies doctoral degrees went to men and 67% went to women.
 The largest share of ethnic studies doctoral degree graduates at Oregon State University were Hispanic or Latino. Approximately 33% of graduates fell into this category.
The following table and chart show the ethnic background for students who recently graduated from Oregon State University with a doctoral in ethnic studies.
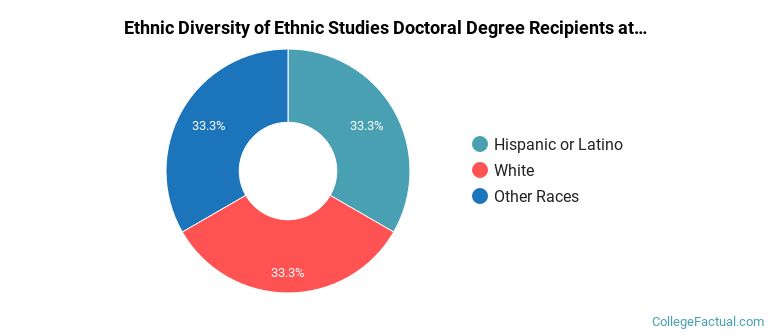
| Ethnic Background | Number of Students |
|---|---|
| Asian | 0 |
| Black or African American | 0 |
| Hispanic or Latino | 1 |
| White | 1 |
| Non-Resident Aliens | 0 |
| Other Races | 1 |
Oregon State University awarded 3 doctoral completions in women’s studies recently — 67% to women and 33% to men. The largest share of these graduates were Hispanic or Latino (33%).
You can also study this field as an undergraduate at Oregon State University. The following undergraduate award levels are reported.
| Undergraduate Level | Annual Graduates |
|---|---|
| Bachelor’s Degrees in Ethnic Studies | 14 |