Visual & Performing Arts is a concentration offered under the general visual and performing arts major at Regent University. We’ve gathered data and other essential information about the master’s degree program in visual arts, such as if the program is offered online, ethnicity of students, how many students graduated in recent times, and more.
You can jump to any section of this page using the links below:
Part-time graduates at Regent paid an average of $648 per credit hour in 2019-2020. This tuition was the same for both in-state and out-of-state students. Information about average full-time graduate student tuition and fees is shown in the table below.
| In State | Out of State | |
|---|---|---|
| Tuition | $15,552 | $15,552 |
| Fees | $1,500 | $1,500 |
Regent does not offer an online option for its visual arts master’s degree program at this time. To see if the school offers distance learning options in other areas, visit the Regent Online Learning page.
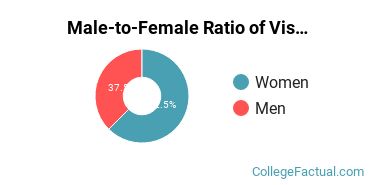
Of the students who received their master’s degree in visual arts in 2019-2020, 62.5% of them were women. This is in the same ballpark of the nationwide number of 60.7%.
Around 12.5% of visual arts master’s degree recipients at Regent in 2019-2020 were awarded to racial-ethnic minorities*. This is lower than the nationwide number of 25%.
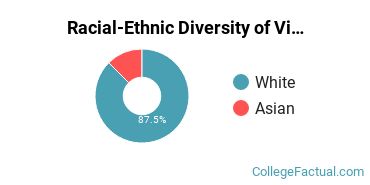
| Race/Ethnicity | Number of Students |
|---|---|
| Asian | 1 |
| Black or African American | 0 |
| Hispanic or Latino | 0 |
| Native American or Alaska Native | 0 |
| Native Hawaiian or Pacific Islander | 0 |
| White | 7 |
| International Students | 0 |
| Other Races/Ethnicities | 0 |
*The racial-ethnic minorities count is calculated by taking the total number of students and subtracting white students, international students, and students whose race/ethnicity was unknown. This number is then divided by the total number of students at the school to obtain the racial-ethnic minorities percentage.
More about our data sources and methodologies.