Social Work is a concentration offered under the social work major at Southern Illinois University Carbondale. We’ve pulled together some essential information you should know about the master’s degree program in social work, including how many students graduate each year, the ethnic diversity of these students, and more.
If there’s something special you’re looking for, you can use one of the links below to find it:
During the 2019-2020 academic year, part-time graduate students at SIUC paid an average of $1,174 per credit hour if they came to the school from out-of-state. In-state students paid a discounted rate of $470 per credit hour. Information about average full-time graduate student tuition and fees is shown in the table below.
| In State | Out of State | |
|---|---|---|
| Tuition | $11,268 | $28,170 |
| Fees | $4,758 | $4,758 |
SIUC does not offer an online option for its social work master’s degree program at this time. To see if the school offers distance learning options in other areas, visit the SIUC Online Learning page.
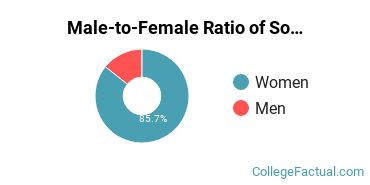
Of the students who received their master’s degree in social work in 2019-2020, 85.7% of them were women. This is about the same as the countrywide number of 87.2%.
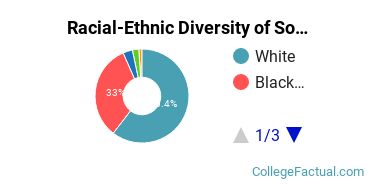
Of those graduates who received a master’s degree in social work at SIUC in 2019-2020, 37.4% were racial-ethnic minorities*. This is lower than the nationwide number of 42%.
| Race/Ethnicity | Number of Students |
|---|---|
| Asian | 0 |
| Black or African American | 30 |
| Hispanic or Latino | 3 |
| Native American or Alaska Native | 0 |
| Native Hawaiian or Pacific Islander | 0 |
| White | 55 |
| International Students | 2 |
| Other Races/Ethnicities | 1 |
*The racial-ethnic minorities count is calculated by taking the total number of students and subtracting white students, international students, and students whose race/ethnicity was unknown. This number is then divided by the total number of students at the school to obtain the racial-ethnic minorities percentage.
More about our data sources and methodologies.