The main focus area for this major is Other Educational Administration & Supervision. For more details on this concentration, visit its profile page.
Educational Administration is a major offered under the education program of study at Strayer University - District of Columbia. Here, you’ll find out more about the major master’s degree program in education admin, including such details as the number of graduates, ethnicity of students, related majors and concentrations, and more.
If there’s something special you’re looking for, you can use one of the links below to find it:
Part-time graduates at Strayer University - District of Columbia paid an average of $553 per credit hour in 2019-2020. This tuition was the same for both in-state and out-of-state students. The following table shows the average full-time tuition and fees for graduate student.
| In State | Out of State | |
|---|---|---|
| Tuition | $14,940 | $14,940 |
| Fees | $195 | $195 |
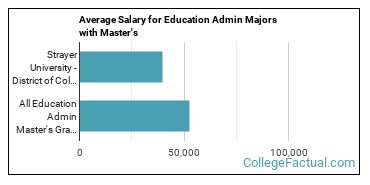
education admin who receive their master’s degree from Strayer University - District of Columbia make an average of $39,626 a year during the early days of their career. That is 25% lower than the national average of $52,816.
If you’re one of the many students who want the flexibility of distance learning courses, you’ll be happy to hear that Strayer University - District of Columbia offers online option in its education admin master’s degree program. To see if the school offers distance learning options in other areas, visit the Strayer University - District of Columbia Online Learning page.
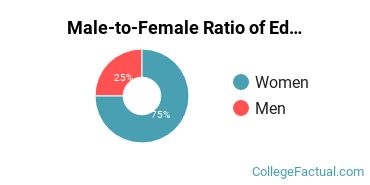
About 75.0% of the students who received their Master’s in education admin in 2019-2020 were women. This is higher than the nationwide number of 69.6%.
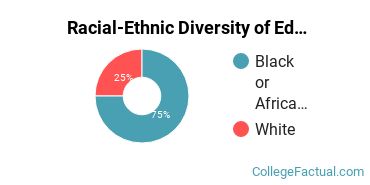
Around 75.0% of education admin master’s degree recipients at Strayer University - District of Columbia in 2019-2020 were awarded to racial-ethnic minorities*. This is higher than the nationwide number of 31%.
| Race/Ethnicity | Number of Students |
|---|---|
| Asian | 0 |
| Black or African American | 3 |
| Hispanic or Latino | 0 |
| Native American or Alaska Native | 0 |
| Native Hawaiian or Pacific Islander | 0 |
| White | 1 |
| International Students | 0 |
| Other Races/Ethnicities | 0 |
Educational Administration students may decide to major in one of the following focus areas.
| Focus Area | Annual Graduates |
|---|---|
| Other Educational Administration & Supervision | 4 |
*The racial-ethnic minorities count is calculated by taking the total number of students and subtracting white students, international students, and students whose race/ethnicity was unknown. This number is then divided by the total number of students at the school to obtain the racial-ethnic minorities percentage.
More about our data sources and methodologies.