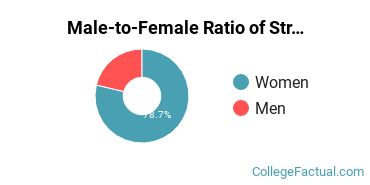
The total graduate student population at Strayer University - Texas is made up of 78.7% women and 21.3% men. Note that these percentages may differ for certain degree programs.
About 82.9% of the graduate students who attend Strayer University - Texas are from a racial-ethnic minority group*. Americans aren't the only ones who appreciate the graduate programs at Strayer University - Texas. Around 1.0% of graduate students are international. The following chart shows the distribution of racial-ethnic groups at the school. If you click on it, you'll find more detailed information.

The average graduate full-time tuition and fees is shown in the table below.
| In-State | Out-of-State | |
|---|---|---|
| Tuition | $14,940 | $14,940 |
| Fees | $195 | $195 |
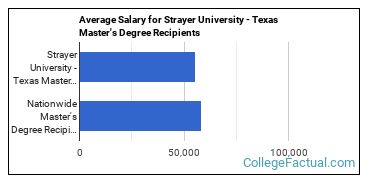
After obtaining their master's degree from Strayer University - Texas, graduates go on to jobs earning an average starting salary of $55,502. When comparing to other master's degree holders, that's on the low side. It's about 5% lower than the national average of $58,425.
Get more details about the location of Strayer University - Texas.

Contact details for Strayer University - Texas are given below.
| Contact Details | |
|---|---|
| Address: | 2711 Lbj Freeway, Farmers Branch, TX 75234 |
| Phone: | 877-445-7180 |
| Website: | www.strayer.edu/campus-locations |
| Facebook: | https://www.facebook.com/StrayerUniversity |
| Twitter: | http://www.twitter.com/strayeru |
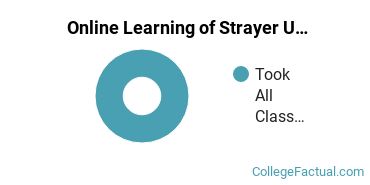
During the 2020-2021 academic year, 100.0% of the graduate students at Strayer University - Texas took all of their courses online.
The only degree programs listed here are those in which master’s degrees were awarded in 2020-2021.
| Master’s Degree Program | Annual Graduates |
|---|---|
| Accounting | 5 |
| Business Administration & Management | 37 |
| Educational Administration | 14 |
| Health & Medical Administrative Services | 7 |
| Human Resource Management | 17 |
| Information Science | 9 |
| Information Technology | 3 |
| Public Administration | 3 |
Footnotes
*The racial-ethnic minorities count is calculated by taking the total number of students and subtracting white students, international students, and students whose race/ethnicity was unknown. This number is then divided by the total number of students at the school to obtain the racial-ethnic minorities percentage.
References
More about our data sources and methodologies.