Communications is a concentration offered under the communication and media studies major at University of Colorado at Colorado Springs. Here, you’ll find out more about the major master’s degree program in communication arts, including such details as the number of graduates, ethnicity of students, related majors and concentrations, and more.
If there’s something special you’re looking for, you can use one of the links below to find it:
During the 2019-2020 academic year, part-time graduate students at UCCS paid an average of $1,123 per credit hour if they came to the school from out-of-state. In-state students paid a discounted rate of $714 per credit hour. Information about average full-time graduate student tuition and fees is shown in the table below.
| In State | Out of State | |
|---|---|---|
| Tuition | $13,918 | $25,774 |
Online degrees for the UCCS communication arts master’s degree program are not available at this time. To see if the school offers distance learning options in other areas, visit the UCCS Online Learning page.
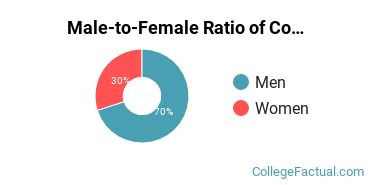
Women made up around 90.0% of the communication arts students who took home a master’s degree in 2019-2020. This is higher than the nationwide number of 71.9%.
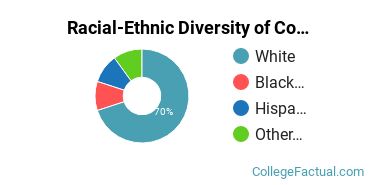
Of those graduates who received a master’s degree in communication arts at UCCS in 2019-2020, 40.0% were racial-ethnic minorities*. This is higher than the nationwide number of 33%.
| Race/Ethnicity | Number of Students |
|---|---|
| Asian | 0 |
| Black or African American | 0 |
| Hispanic or Latino | 2 |
| Native American or Alaska Native | 0 |
| Native Hawaiian or Pacific Islander | 0 |
| White | 6 |
| International Students | 0 |
| Other Races/Ethnicities | 2 |
*The racial-ethnic minorities count is calculated by taking the total number of students and subtracting white students, international students, and students whose race/ethnicity was unknown. This number is then divided by the total number of students at the school to obtain the racial-ethnic minorities percentage.
More about our data sources and methodologies.