Below are the key facts about graduate study in political science & government at UNOMAHA. It is offered at the Master’s, Graduate Certificate levels, with undergraduate study also available. At its best it places at #1 out of 1 schools (Master’s level) by College Factual. Jump to any of the following sections:
College Factual ranks UNOMAHA highly for political science & government, coming in at #493 out of 681 schools nationally.
The following degree levels are available for political science & government at UNOMAHA, along with how many graduates complete each level annually.
| Degree Level | Annual Graduates |
|---|---|
| Bachelor’s | 34 |
| Master’s | 22 |
| Graduate Certificate | 5 |
During the most recent reporting year, University of Nebraska at Omaha awarded 22 master’s degrees in political science & government.
UNOMAHA is among the very best schools in the country for political science & government at the master’s level. Specifically, it ranked #1 out of 1 schools by College Factual.
Among recent graduates, 59% of political science & government master’s degrees went to men and 41% went to women.
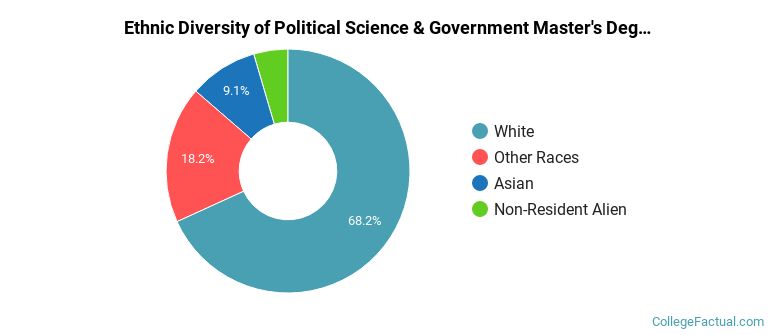
 The largest share of political science & government master’s degree graduates at UNOMAHA are White. About 68% of graduates fell into this category.
The following table and chart show the ethnic background for students who recently graduated from University of Nebraska at Omaha with a master’s in political science & government.
| Ethnic Background | Number of Students |
|---|---|
| Asian | 2 |
| Black or African American | 0 |
| Hispanic or Latino | 0 |
| White | 15 |
| Non-Resident Aliens | 1 |
| Other Races | 4 |
UNOMAHA conferred 22 master’s completions in political science and government, general in the most recent reporting year — 41% to women and 59% to men. The largest share of these graduates were White (68%).
For the most recent IPEDS reporting year, University of Nebraska at Omaha handed out 5 graduate certificate degrees in political science & government.
UNOMAHA is not currently ranked for political science & government at the graduate certificate level.
In the most recent graduating class, 20% of political science & government graduate certificate degrees went to men and 80% went to women.
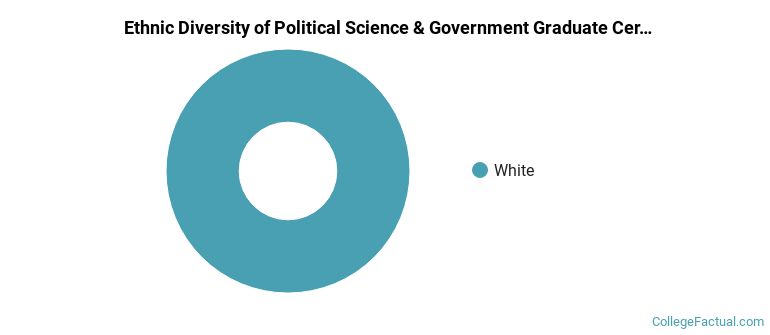
 The majority of political science & government graduate certificate degree graduates at UNOMAHA are White. About 100% of graduates fell into this category.
The following table and chart show the ethnic background for students who recently graduated from University of Nebraska at Omaha with a graduate certificate in political science & government.
| Ethnic Background | Number of Students |
|---|---|
| Asian | 0 |
| Black or African American | 0 |
| Hispanic or Latino | 0 |
| White | 5 |
| Non-Resident Aliens | 0 |
| Other Races | 0 |
UNOMAHA awarded 5 graduate certificate degrees in american government and politics (united states) in the most recent reporting year — 80% to women and 20% to men. The most common background among these graduates was White (100%).
Undergraduate study is also available at UNOMAHA. Annual undergraduate completions by level are shown below.
| Undergraduate Level | Annual Graduates |
|---|---|
| Bachelor’s Degrees in Political Science & Government | 34 |