General History is a concentration offered under the history major at University of Pennsylvania. We’ve pulled together some essential information you should know about the doctor’s degree program in general history, including how many students graduate each year, the ethnic diversity of these students, and more.
You can jump to any section of this page using the links below:
In 2019-2020, the average part-time graduate tuition at UPenn was $1,855 per credit hour for both in-state and out-of-state students. The following table shows the average full-time tuition and fees for graduate student.
| In State | Out of State | |
|---|---|---|
| Tuition | $37,678 | $37,678 |
| Fees | $4,082 | $4,082 |
UPenn does not offer an online option for its general history doctor’s degree program at this time. To see if the school offers distance learning options in other areas, visit the UPenn Online Learning page.
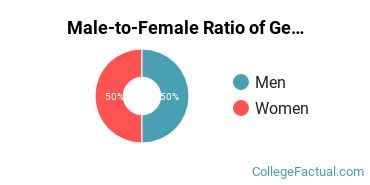
About 50.0% of the students who received their PhD in general history in 2019-2020 were women. This is higher than the nationwide number of 41.3%.
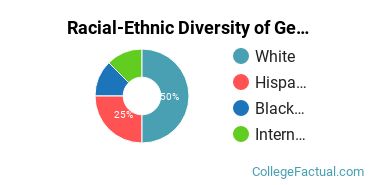
Around 37.5% of general history doctor’s degree recipients at UPenn in 2019-2020 were awarded to racial-ethnic minorities*. This is higher than the nationwide number of 16%.
| Race/Ethnicity | Number of Students |
|---|---|
| Asian | 0 |
| Black or African American | 1 |
| Hispanic or Latino | 2 |
| Native American or Alaska Native | 0 |
| Native Hawaiian or Pacific Islander | 0 |
| White | 4 |
| International Students | 1 |
| Other Races/Ethnicities | 0 |
You may also be interested in one of these majors related to general history.
| Related Major | Annual Graduates |
|---|---|
| History and Philosophy of Science and Technology | 5 |
| Other History | 4 |
View All General History Related Majors >
*The racial-ethnic minorities count is calculated by taking the total number of students and subtracting white students, international students, and students whose race/ethnicity was unknown. This number is then divided by the total number of students at the school to obtain the racial-ethnic minorities percentage.
More about our data sources and methodologies.