The main focus area for this major is General History. For more details on this concentration, visit its profile page.
History is a major offered under the history program of study at Virginia Commonwealth University. Here, you’ll find out more about the major master’s degree program in history, including such details as the number of graduates, ethnicity of students, related majors and concentrations, and more.
You can jump to any section of this page using the links below:
During the 2019-2020 academic year, part-time graduate students at VCU paid an average of $1,448 per credit hour if they came to the school from out-of-state. In-state students paid a discounted rate of $707 per credit hour. The following table shows the average full-time tuition and fees for graduate student.
| In State | Out of State | |
|---|---|---|
| Tuition | $12,703 | $26,041 |
| Fees | $2,497 | $3,187 |
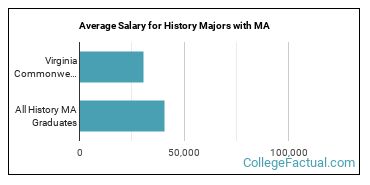
history who receive their master’s degree from VCU make an average of $30,409 a year during the early days of their career. That is 25% lower than the national average of $40,606.
VCU does not offer an online option for its history master’s degree program at this time. To see if the school offers distance learning options in other areas, visit the VCU Online Learning page.
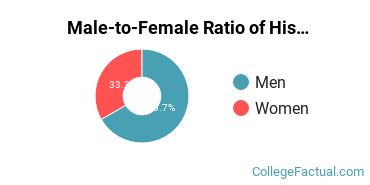
Of the students who received their master’s degree in history in 2019-2020, 33.3% of them were women. This is less than the nationwide number of 46.6%.
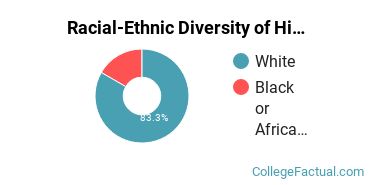
Around 16.7% of history master’s degree recipients at VCU in 2019-2020 were awarded to racial-ethnic minorities*. This is about the same as the nationwide number of 18%.
| Race/Ethnicity | Number of Students |
|---|---|
| Asian | 0 |
| Black or African American | 1 |
| Hispanic or Latino | 0 |
| Native American or Alaska Native | 0 |
| Native Hawaiian or Pacific Islander | 0 |
| White | 5 |
| International Students | 0 |
| Other Races/Ethnicities | 0 |
History students may decide to major in one of the following focus areas.
| Focus Area | Annual Graduates |
|---|---|
| General History | 6 |
*The racial-ethnic minorities count is calculated by taking the total number of students and subtracting white students, international students, and students whose race/ethnicity was unknown. This number is then divided by the total number of students at the school to obtain the racial-ethnic minorities percentage.
More about our data sources and methodologies.