Women make up 44.2% of the total graduate student body at Wittenberg while men make you 55.8%. These percentages may be different for specific degree programs.

About 9.3% of the graduate students who attend Wittenberg are from a racial-ethnic minority group*. The following chart shows the distribution of racial-ethnic groups at the school. If you click on it, you'll find more detailed information.

The average tuition and fees for graduate students is shown below.
| In-State | Out-of-State | |
|---|---|---|
| Tuition | $8,352 | $8,352 |
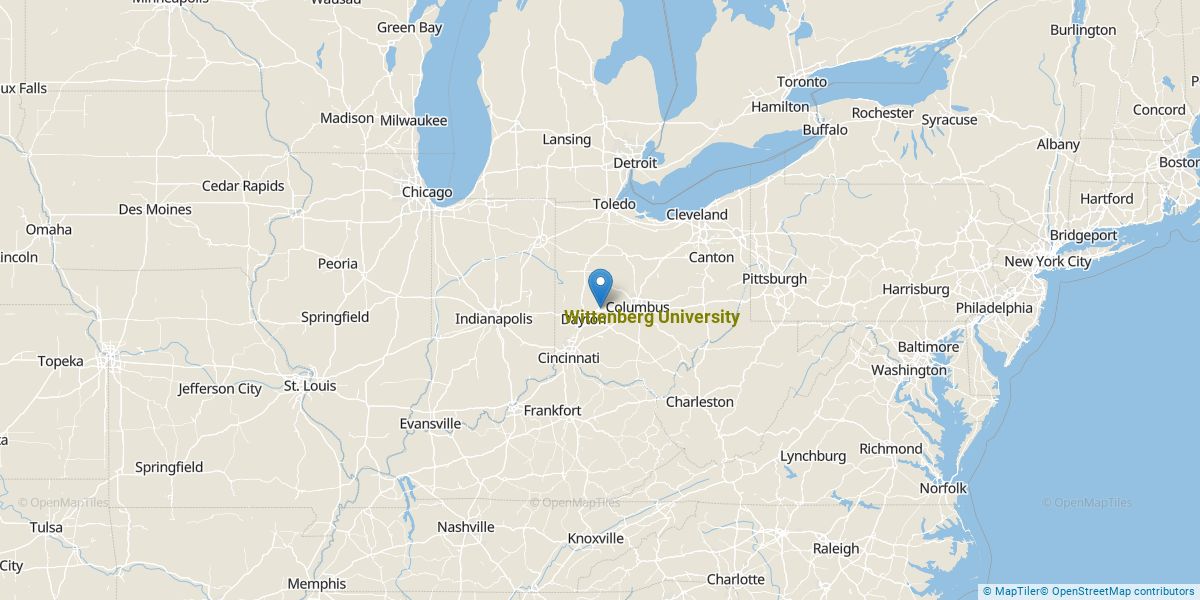
Get more details about the location of Wittenberg University.
Contact details for Wittenberg are given below.
| Contact Details | |
|---|---|
| Address: | Ward St At N Wittenberg Ave, Springfield, OH 45504 |
| Phone: | 937-327-6231 |
| Website: | www.wittenberg.edu/ |
| Facebook: | https://www.facebook.com/wittenberguniversity |
| Twitter: | https://twitter.com/wittenberg |
During the 2020-2021 academic year, 57.5% of the graduate students at Wittenberg took at least one online course.

The only degree programs listed here are those in which master’s degrees were awarded in 2020-2021.
| Master’s Degree Program | Annual Graduates |
|---|---|
| Health & Physical Education | 7 |
| Management Sciences & Quantitative Methods | 11 |
| Teacher Education Grade Specific | 4 |
Footnotes
*The racial-ethnic minorities count is calculated by taking the total number of students and subtracting white students, international students, and students whose race/ethnicity was unknown. This number is then divided by the total number of students at the school to obtain the racial-ethnic minorities percentage.
References
More about our data sources and methodologies.