Here, you'll find out more about the major, including such details as the number of graduates, what degree levels are offered, ethnicity of students, and more. In addition, we cover how Amarillo College ranks in comparison to other schools with medical assisting programs.
Go directly to any of the following sections:
The bachelor's program at Amarillo College was ranked #93 on College Factual's Best Schools for medical assisting list.
During the 2022-2023 academic year, part-time undergraduate students at Amarillo College paid an average of $196 per credit hour if they came to the school from out-of-state. In-state students paid a discounted rate of $132 per credit hour. The average full-time tuition and fees for undergraduates are shown in the table below.
| In State | Out of State | |
|---|---|---|
| Tuition | $1,128 | $2,664 |
| Fees | $2,040 | $2,040 |
| Books and Supplies | $1,854 | $1,854 |
Learn more about Amarillo College tuition and fees.
Online degrees for the Amarillo College medical assisting bachelor’s degree program are not available at this time. To see if the school offers distance learning options in other areas, visit the Amarillo College Online Learning page.
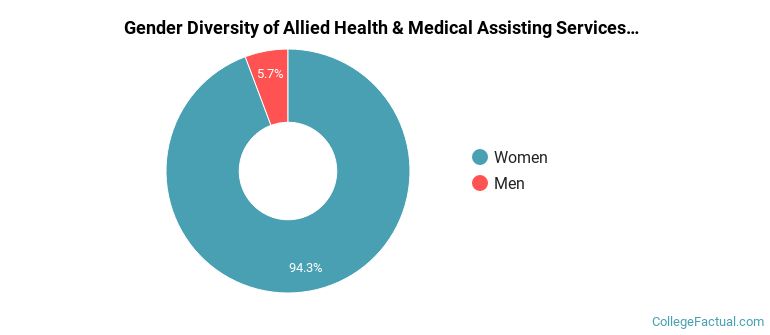
Of the 35 students who earned an associate's degree in Allied Health & Medical Assisting Services from Amarillo College in 2021-2022, 6% were men and 94% were women.
The majority of the associate's degree graduates for this major are Hispanic or Latino. In the most recent graduating class for which data is available, 54% of grads fell into this category.
The following table and chart show the ethnic background for students who recently graduated from Amarillo College with a associate's in medical assisting.
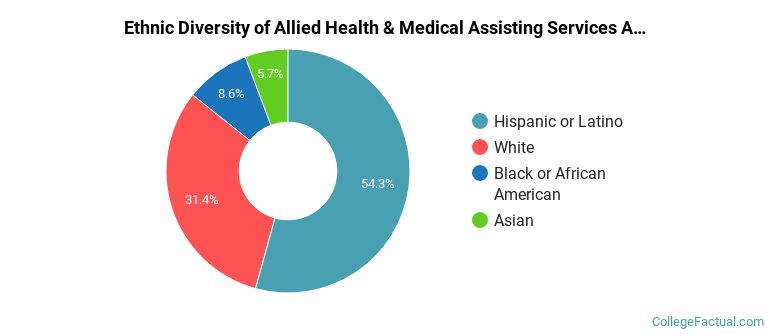
| Ethnic Background | Number of Students |
|---|---|
| Asian | 2 |
| Black or African American | 3 |
| Hispanic or Latino | 19 |
| White | 11 |
| Non-Resident Aliens | 0 |
| Other Races | 0 |
| Related Major | Annual Graduates |
|---|---|
| Nursing | 205 |
| Allied Health Professions | 125 |
| Practical Nursing & Nursing Assistants | 54 |
| Dental Support Services | 25 |
| Clinical/Medical Laboratory Science | 12 |
View All Allied Health & Medical Assisting Services Related Majors >