Explore the best ranked schools for the programs you are most interested in.
Amridge was not ranked in College Factual's Best Overall Colleges report this year. This may be because not enough data was available.
Since Amridge University has an open admissions policy, being accepted to the school isn't that hard. However, a full basic things - such as a high school diploma or equivalent - may be required. Also, go over your application to make sure it is complete before you submit it.
The student to faculty ratio is often used to measure the number of teaching resources that a college or university offers its students. The national average for this metric is 15 to 1, but at Amridge it is much better at 12 to 1. That's good news for students who want to interact more on a personal level with their teachers.
In addition to the student to faculty ratio, some people look at what percentage of faculty members are full-time as a sign of how much time professors will be able to spend with their students. This is because part-time teachers may not be be on campus as much as their full-time counterparts.
The full-time faculty percentage at Amridge University is 100%. This is higher than the national average of 47%.
When we say that a student has graduated on time, we mean that they have finished their bachelor's degree within four years. The on-time graduation rate at Amridge is 25%. That's lower than the national rate of 33.3%
Find out more about the retention and graduation rates at Amridge University.
During the 2017-2018 academic year, there were 298 undergraduates at Amridge with 172 being full-time and 126 being part-time.
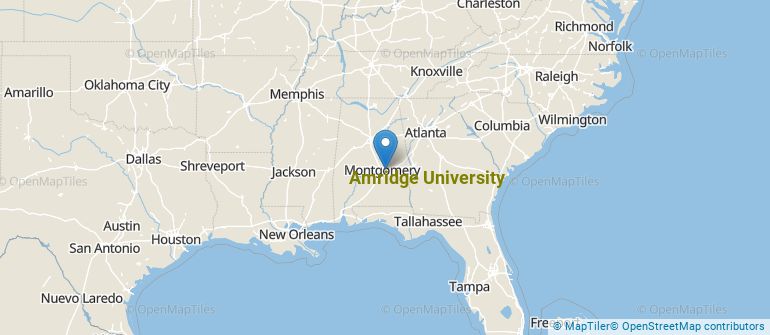
Get more details about the location of Amridge University.
Contact details for Amridge are given below.
| Contact Details | |
|---|---|
| Address: | 1200 Taylor Rd, Montgomery, AL 36117-3553 |
| Phone: | 334-387-3877 |
| Website: | https://www.amridgeuniversity.edu/ |
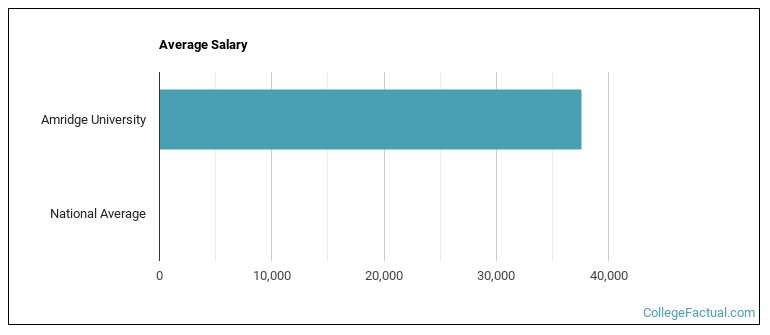
| Most Popular Majors | Bachelor’s Degrees | Average Salary of Graduates |
|---|---|---|
| Business Administration & Management | 54 | NA |
| Human Development & Family Studies | 42 | NA |
| Biblical Studies | 29 | NA |
| Theological & Ministerial Studies | 18 | NA |
| Pastoral Counseling & Specialized Ministries | 17 | NA |
| Human Resource Management | 11 | NA |
| Mental & Social Health Services | 9 | NA |
| Criminal Justice & Corrections | 9 | NA |
| Religious Studies | 7 | NA |
| Management Information Systems | 5 | NA |
Online learning options are becoming more and more popular at American colleges and universities. Online classes are great for students who have busy schedules or for those who just want to study on their own time.
In 2022-2023, 647 students took at least one online class at Amridge University. This is a decrease from the 723 students who took online classes the previous year.
| Year | Took at Least One Online Class | Took All Classes Online |
|---|---|---|
| 2022-2023 | 647 | 647 |
| 2021-2022 | 723 | 723 |
| 2020-2021 | 775 | 775 |
| 2018-2019 | 755 | 755 |
If you’re considering Amridge University, here are some more schools you may be interested in knowing more about.
Curious on how these schools stack up against Amridge? Pit them head to head with College Combat, our free interactive tool that lets you compare college on the features that matter most to you!
Footnotes
*The racial-ethnic minorities count is calculated by taking the total number of students and subtracting white students, international students, and students whose race/ethnicity was unknown. This number is then divided by the total number of students at the school to obtain the racial-ethnic minorities percentage.
References
More about our data sources and methodologies.