Explore the best ranked schools for the programs you are most interested in.
Antioch College was not ranked in College Factual's Best Overall Colleges report this year. This may be because not enough data was available.
When it comes to admittance, Antioch College is somewhat selective. Its acceptance rate is 83%, which means you'll face some strong competition during the admissions process. Do what you can to make your application stand out.
About 11% of students accepted to Antioch College submitted their SAT scores.Antioch College received ACT scores from 15% of accepted students.
The student to faculty ratio at Antioch College is an impressive 6 to 1. That's quite good when you compare it to the national average of 15 to 1. This is a good sign that students at the school will have more opportunities for one-on-one interactions with their professors.
Another measure that is often used to estimate how much access students will have to their professors is how many faculty members are full-time. The idea here is that part-time faculty tend to spend less time on campus, so they may not be as available to students as full-timers.
The full-time faculty percentage at Antioch College is 89%. This is higher than the national average of 47%.
The freshmen retention rate of 73% tells us that most first-year, full-time students like Antioch College enough to come back for another year. This is a fair bit higher than the national average of 68%. That's certainly something to check off in the good column about the school.
The on-time graduation rate for someone pursuing a bachelor's degree is typically four years. This rate at Antioch College for first-time, full-time students is 59%, which is better than the national average of 33.3%.
Find out more about the retention and graduation rates at Antioch College.
During the 2017-2018 academic year, there were 116 full-time undergraduates at Antioch College.
| $0-30 K | $30K-48K | $48-75 | $75-110K | $110K + |
|---|---|---|---|---|
| $14,911 | $16,995 | $18,239 | $23,912 | $24,445 |
The net price is calculated by adding tuition, room, board and other costs and subtracting financial aid.Note that the net price is typically less than the published for a school. For more information on the sticker price of Antioch College, see our tuition and fees and room and board pages.
It's not uncommon for college students to take out loans to pay for school. In fact, almost 66% of students nationwide depend at least partially on loans. At Antioch College, approximately 63% of students took out student loans averaging $3,708 a year. That adds up to $14,832 over four years for those students.
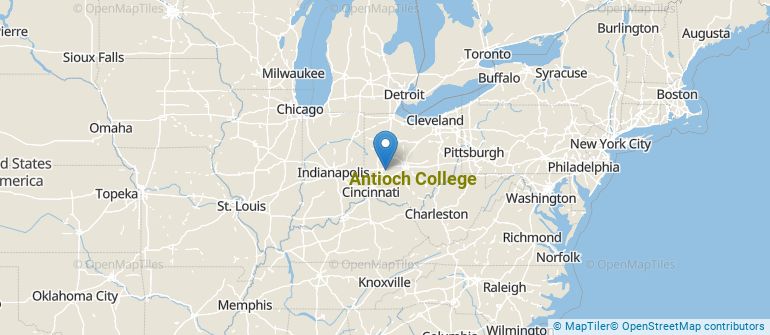
Get more details about the location of Antioch College.
Contact details for Antioch College are given below.
| Contact Details | |
|---|---|
| Address: | 1 Morgan Pl, Yellow Springs, OH 45387 |
| Phone: | 937-319-6082 |
| Website: | antiochcollege.edu/ |
| Facebook: | https://www.facebook.com/antiochcollege |
| Twitter: | http://www.twitter.com/AntiochCollege |
| Most Popular Majors | Bachelor’s Degrees | Average Salary of Graduates |
|---|---|---|
| Liberal Arts General Studies | 5 | NA |
| General Psychology | 5 | NA |
| General Biology | 4 | NA |
| Natural Resources Conservation | 2 | NA |
| Philosophy | 1 | NA |
| Anthropology | 1 | NA |
| Political Science & Government | 1 | NA |
| Literature | 0 | NA |
| History | 0 | NA |
| Fine & Studio Arts | 0 | NA |
Online learning is becoming popular at even the oldest colleges and universities in the United States. Not only are online classes great for returning adults with busy schedules, they are also frequented by a growing number of traditional students.
In 2022-2023, 7 students took at least one online class at Antioch College. This is a decrease from the 35 students who took online classes the previous year.
| Year | Took at Least One Online Class | Took All Classes Online |
|---|---|---|
| 2022-2023 | 7 | 0 |
| 2021-2022 | 35 | 1 |
| 2020-2021 | 16 | 16 |
| 2018-2019 | 6 | 0 |
Footnotes
*The racial-ethnic minorities count is calculated by taking the total number of students and subtracting white students, international students, and students whose race/ethnicity was unknown. This number is then divided by the total number of students at the school to obtain the racial-ethnic minorities percentage.
References
More about our data sources and methodologies.