Explore the best ranked schools for the programs you are most interested in.
Appalachian Bible College was not ranked in College Factual's 2025 Best Overall Colleges report. This could be for a number of reasons, including lack of data.
Because it has a high acceptance rate of 100%, some consider Appalachian Bible College to be a safety school. But don't just assume that admittance is in the bag. Make sure to spend enough time on your application so that it is in tip-top shape.
About 47% of students accepted to Appalachian Bible College submitted their SAT scores. When looking at the 25th through the 75th percentile, SAT Evidence-Based Reading and Writing scores ranged between 523 and 618. Math scores were between 513 and 570.
The student to faculty ratio at Appalachian Bible College is an impressive 9 to 1. That's quite good when you compare it to the national average of 15 to 1. This is a good sign that students at the school will have more opportunities for one-on-one interactions with their professors.
In addition to the student to faculty ratio, some people look at what percentage of faculty members are full-time as a sign of how much time professors will be able to spend with their students. This is because part-time teachers may not be be on campus as much as their full-time counterparts.
The full-time faculty percentage at Appalachian Bible College is 63%. This is higher than the national average of 47%.
The freshmen retention rate of 76% tells us that most first-year, full-time students like Appalachian Bible College enough to come back for another year. This is a fair bit higher than the national average of 68%. That's certainly something to check off in the good column about the school.
The on-time graduation rate for someone pursuing a bachelor's degree is typically four years. This rate at Appalachian Bible College for first-time, full-time students is 52%, which is better than the national average of 33.3%.
Find out more about the retention and graduation rates at Appalachian Bible College.
During the 2017-2018 academic year, there were 221 undergraduates at Appalachian Bible College with 150 being full-time and 71 being part-time.
The net price is calculated by adding tuition, room, board and other costs and subtracting financial aid.Note that the net price is typically less than the published for a school. For more information on the sticker price of Appalachian Bible College, see our tuition and fees and room and board pages.
Almost 66% of college students who graduated with the class of 2018 took out student loans, but that percentage varies from school to school. At Appalachian Bible College, approximately 42% of students took out student loans averaging $3,455 a year. That adds up to $13,820 over four years for those students.
Get more details about paying for Appalachian Bible College.
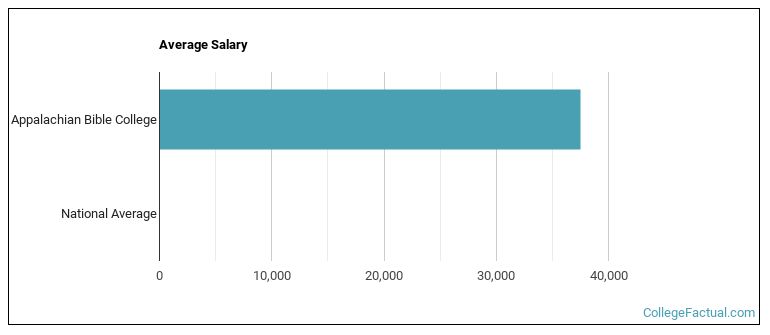
See which majors at Appalachian Bible College make the most money.
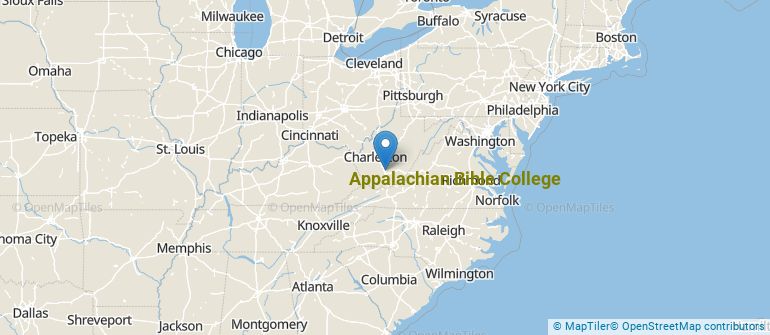
Get more details about the location of Appalachian Bible College.
Contact details for Appalachian Bible College are given below.
| Contact Details | |
|---|---|
| Address: | 161 College Drive, Mount Hope, WV 25880-9557 |
| Phone: | 304-877-6428 |
| Website: | https://abc.edu/ |
| Facebook: | http://www.facebook.com/pages/Bradley-WV/Appalachian-Bible-College/174006840360 |
| Most Popular Majors | Bachelor’s Degrees | Average Salary of Graduates |
|---|---|---|
| Biblical Studies | 32 | $21,367 |
| Theological & Ministerial Studies | 1 | NA |
Online learning options are becoming more and more popular at American colleges and universities. Online classes are great for students who have busy schedules or for those who just want to study on their own time.
In 2022-2023, 67 students took at least one online class at Appalachian Bible College. This is an increase from the 59 students who took online classes the previous year.
| Year | Took at Least One Online Class | Took All Classes Online |
|---|---|---|
| 2022-2023 | 67 | 29 |
| 2021-2022 | 59 | 23 |
| 2020-2021 | 61 | 20 |
| 2018-2019 | 26 | 9 |
Learn more about online learning at Appalachian Bible College.
Footnotes
*The racial-ethnic minorities count is calculated by taking the total number of students and subtracting white students, international students, and students whose race/ethnicity was unknown. This number is then divided by the total number of students at the school to obtain the racial-ethnic minorities percentage.
References
More about our data sources and methodologies.