We've gathered data and other essential information about the program, such as the average salary of graduates, ethnicity of students, how many students graduated in recent times, and more. We've also included details on how Appalachian State ranks compared to other colleges offering a major in mis.
Jump to any of the following sections:
The bachelor's program at Appalachian State was ranked #39 on College Factual's Best Schools for mis list. It is also ranked #1 in North Carolina.
| Ranking Type | Rank |
|---|---|
| Best Management Information Systems Bachelor’s Degree Schools | 34 |
| Best Management Information Systems Schools | 39 |
During the 2021-2022 academic year, Appalachian State University handed out 88 bachelor's degrees in management information systems. This is a decrease of 3% over the previous year when 91 degrees were handed out.
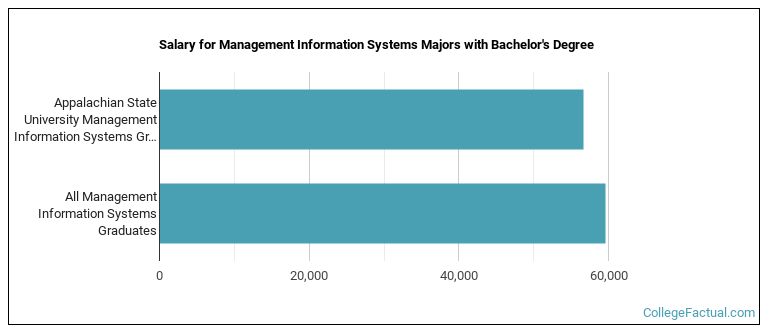
MIS majors who earn their bachelor's degree from Appalachian State go on to jobs where they make a median salary of $56,650 a year. This is less than $59,606, which is the national median of all mis majors in the nation who earn bachelor's degrees.
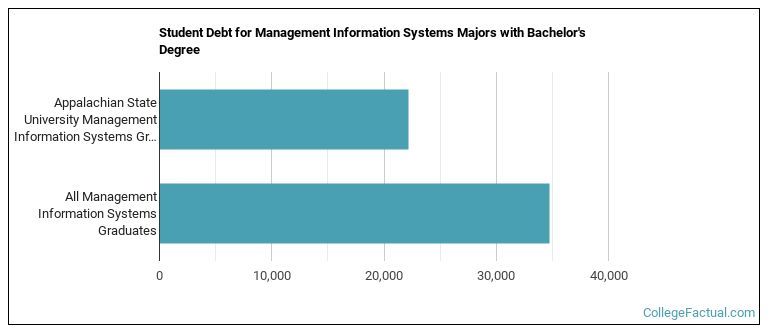
While getting their bachelor's degree at Appalachian State, mis students borrow a median amount of $22,182 in student loans. This is not too bad considering that the median debt load of all mis bachelor's degree recipients across the country is $34,724.
The typical student loan payment of a bachelor's degree student from the mis program at Appalachian State is $229 per month.
In 2022-2023, the average part-time undergraduate tuition at Appalachian State was $885 per credit hour for out-of-state students. The average for in-state students was $177 per credit hour. The following table shows the average full-time tuition and fees for undergraduates.
| In State | Out of State | |
|---|---|---|
| Tuition | $4,242 | $21,238 |
| Fees | $3,299 | $3,299 |
| Books and Supplies | $800 | $800 |
| On Campus Room and Board | $12,258 | $12,258 |
| On Campus Other Expenses | $2,725 | $2,725 |
Learn more about Appalachian State tuition and fees.
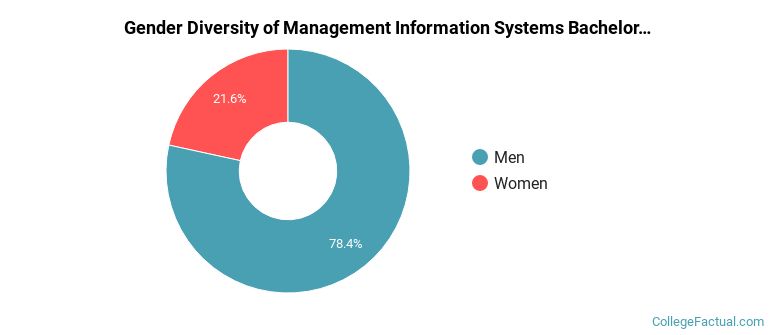
The mis program at Appalachian State awarded 88 bachelor's degrees in 2021-2022. About 78% of these degrees went to men with the other 22% going to women.
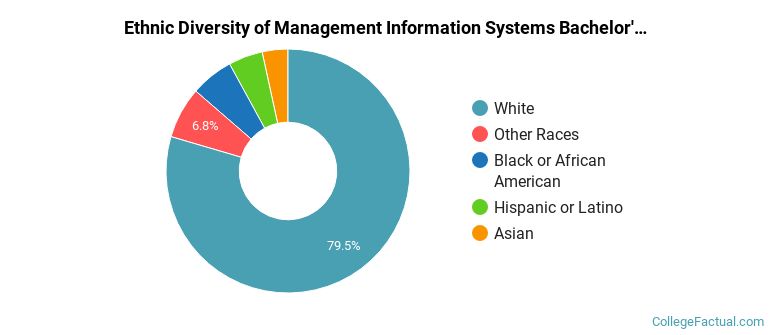
The majority of bachelor's degree recipients in this major at Appalachian State are white. In the most recent graduating class for which data is available, 80% of students fell into this category.
The following table and chart show the ethnic background for students who recently graduated from Appalachian State University with a bachelor's in mis.
| Ethnic Background | Number of Students |
|---|---|
| Asian | 3 |
| Black or African American | 5 |
| Hispanic or Latino | 4 |
| White | 70 |
| Non-Resident Aliens | 0 |
| Other Races | 6 |
Online degrees for the Appalachian State mis bachelor’s degree program are not available at this time. To see if the school offers distance learning options in other areas, visit the Appalachian State Online Learning page.
Take a look at the following statistics related to the make-up of the mis majors at Appalachian State University.
| Related Major | Annual Graduates |
|---|---|
| Business Administration & Management | 309 |
| Marketing | 190 |
| Accounting | 107 |
| Construction Management | 103 |
| Finance & Financial Management | 88 |
More about our data sources and methodologies.