We've gathered data and other essential information about the program, such as the average salary of graduates, ethnicity of students, how many students graduated in recent times, and more. In addition, we cover how Appalachian State ranks in comparison to other schools with criminal justice programs.
Jump to any of the following sections:
The bachelor's program at Appalachian State was ranked #150 on College Factual's Best Schools for criminal justice list. It is also ranked #3 in North Carolina.
| Ranking Type | Rank |
|---|---|
| Best Criminal Justice & Corrections Bachelor’s Degree Schools | 111 |
| Best Criminal Justice & Corrections Schools | 150 |
During the 2021-2022 academic year, Appalachian State University handed out 145 bachelor's degrees in criminal justice & corrections. This is an increase of 13% over the previous year when 128 degrees were handed out.
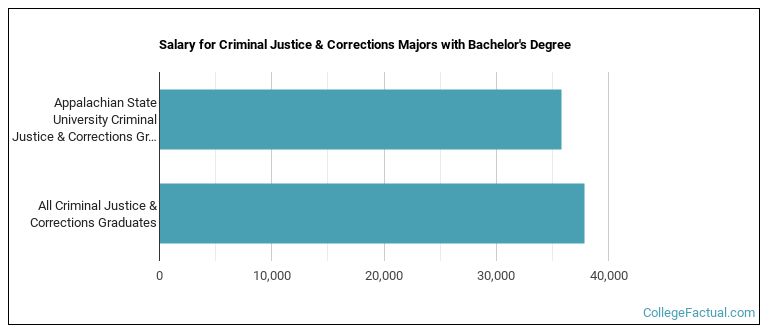
The median salary of criminal justice students who receive their bachelor's degree at Appalachian State is $35,796. This is less than $37,901, which is the national median of all criminal justice majors in the nation who earn bachelor's degrees.
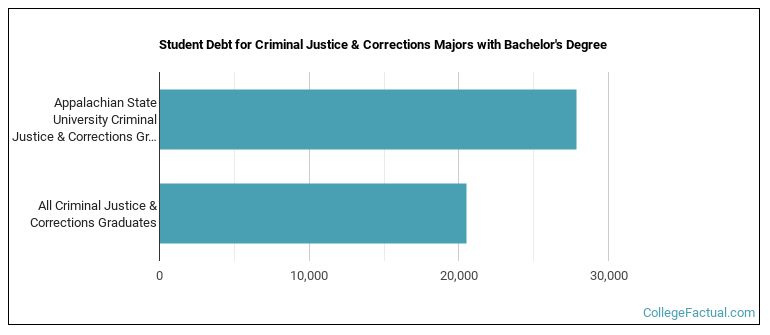
While getting their bachelor's degree at Appalachian State, criminal justice students borrow a median amount of $27,887 in student loans. This is higher than the the typical median of $20,504 for all criminal justice majors across the country.
The typical student loan payment of a bachelor's degree student from the criminal justice program at Appalachian State is $245 per month.
In 2022-2023, the average part-time undergraduate tuition at Appalachian State was $885 per credit hour for out-of-state students. The average for in-state students was $177 per credit hour. Information about average full-time undergraduate tuition and fees is shown in the table below.
| In State | Out of State | |
|---|---|---|
| Tuition | $4,242 | $21,238 |
| Fees | $3,299 | $3,299 |
| Books and Supplies | $800 | $800 |
| On Campus Room and Board | $12,258 | $12,258 |
| On Campus Other Expenses | $2,725 | $2,725 |
Learn more about Appalachian State tuition and fees.
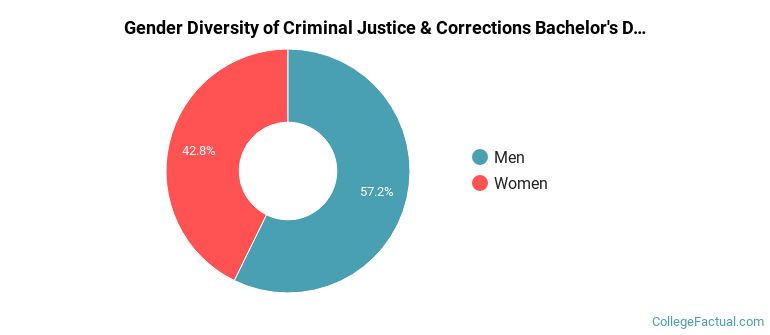
During the 2021-2022 academic year, 145 students graduated with a bachelor's degree in criminal justice from Appalachian State. About 57% were men and 43% were women.
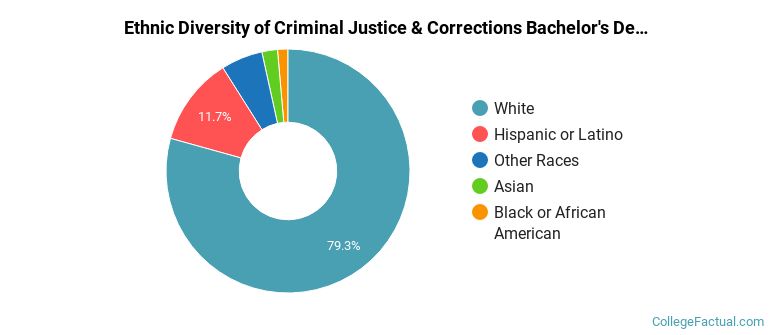
The majority of the students with this major are white. About 79% of 2022 graduates were in this category.
The following table and chart show the ethnic background for students who recently graduated from Appalachian State University with a bachelor's in criminal justice.
| Ethnic Background | Number of Students |
|---|---|
| Asian | 3 |
| Black or African American | 2 |
| Hispanic or Latino | 17 |
| White | 115 |
| Non-Resident Aliens | 0 |
| Other Races | 8 |
Appalachian State does not offer an online option for its criminal justice bachelor’s degree program at this time. To see if the school offers distance learning options in other areas, visit the Appalachian State Online Learning page.
Take a look at the following statistics related to the make-up of the criminal justice majors at Appalachian State University.
More about our data sources and methodologies.