Go directly to any of the following sections:
The bachelor's program at ASU - Tempe was ranked #74 on College Factual's Best Schools for engineering list. It is also ranked #1 in Arizona.
During the 2021-2022 academic year, Arizona State University - Tempe handed out 1406 bachelor's degrees in engineering. This is a decrease of 4% over the previous year when 1,466 degrees were handed out.
In 2022, 941 students received their master’s degree in engineering from ASU - Tempe. This makes it the #7 most popular school for engineering master’s degree candidates in the country.
In addition, 158 students received their doctoral degrees in engineering in 2022, making the school the #16 most popular school in the United States for this category of students.
Out-of-state part-time undergraduates at ASU - Tempe paid an average of $1,310 per credit hour in 2022-2023. The average for in-state students was $808 per credit hour. The following table shows the average full-time tuition and fees for undergraduates.
| In State | Out of State | |
|---|---|---|
| Tuition | $11,308 | $31,450 |
| Fees | $743 | $743 |
| Books and Supplies | $1,320 | $1,320 |
| On Campus Room and Board | $16,091 | $16,091 |
| On Campus Other Expenses | $3,808 | $3,808 |
Learn more about ASU - Tempe tuition and fees.
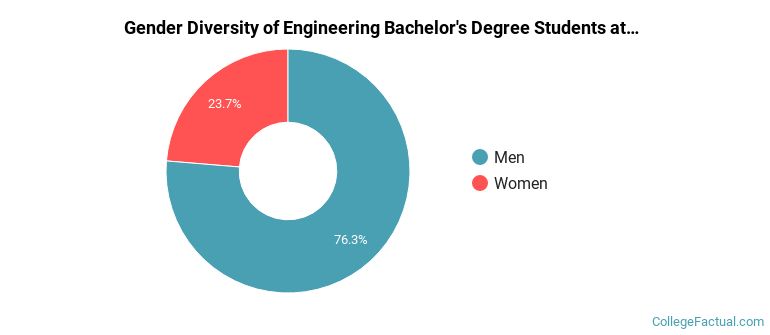
During the 2021-2022 academic year, 1,406 students graduated with a bachelor's degree in engineering from ASU - Tempe. About 76% were men and 24% were women.
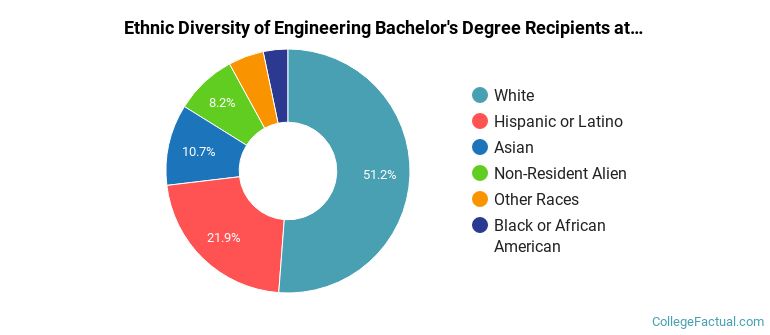
The majority of bachelor's degree recipients in this major at ASU - Tempe are white. In the most recent graduating class for which data is available, 51% of students fell into this category.
The following table and chart show the ethnic background for students who recently graduated from Arizona State University - Tempe with a bachelor's in engineering.
| Ethnic Background | Number of Students |
|---|---|
| Asian | 151 |
| Black or African American | 46 |
| Hispanic or Latino | 308 |
| White | 720 |
| Non-Resident Aliens | 115 |
| Other Races | 66 |
Online degrees for the ASU - Tempe engineering bachelor’s degree program are not available at this time. To see if the school offers distance learning options in other areas, visit the ASU - Tempe Online Learning page.
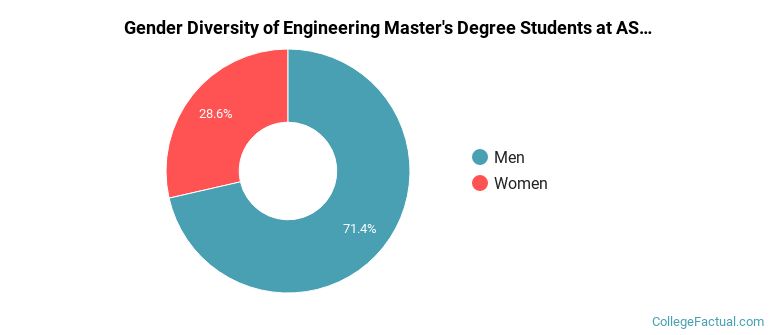
The engineering program at ASU - Tempe awarded 595 master's degrees in 2021-2022. About 71% of these degrees went to men with the other 29% going to women.
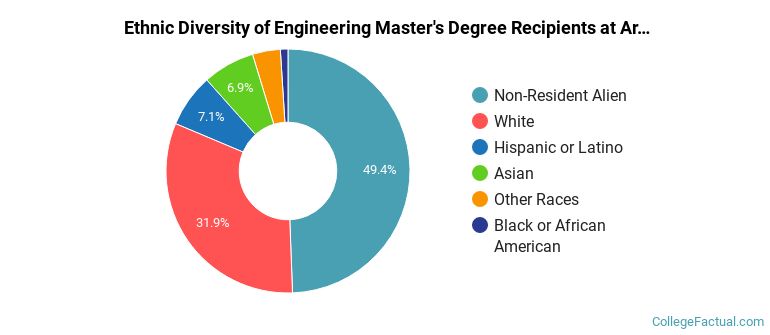
The following table and chart show the ethnic background for students who recently graduated from Arizona State University - Tempe with a master's in engineering.
| Ethnic Background | Number of Students |
|---|---|
| Asian | 41 |
| Black or African American | 6 |
| Hispanic or Latino | 42 |
| White | 190 |
| Non-Resident Aliens | 294 |
| Other Races | 22 |
Take a look at the following statistics related to the make-up of the engineering majors at Arizona State University - Tempe.
Engineering students may decide to major in one of the following focus areas. Individual majors may not be available for all degree levels.
| Related Major | Annual Graduates |
|---|---|
| Biological & Biomedical Sciences | 1,442 |
| Architecture & Related Services | 329 |
| Mathematics & Statistics | 293 |
| Physical Sciences | 281 |
| Natural Resources & Conservation | 242 |
More about our data sources and methodologies.