We've gathered data and other essential information about the program, such as the average salary of graduates, ethnicity of students, how many students graduated in recent times, and more. Also, learn how ASU - Tempe ranks among other schools offering degrees in dance.
Jump to any of the following sections:
The bachelor's program at ASU - Tempe was ranked #26 on College Factual's Best Schools for dance list. It is also ranked #1 in Arizona.
| Ranking Type | Rank |
|---|---|
| Best Dance Schools | 26 |
| Best Dance Bachelor’s Degree Schools | 27 |
During the 2021-2022 academic year, Arizona State University - Tempe handed out 19 bachelor's degrees in dance. Last year, the same number of degrees were handed out.
In 2022, 6 students received their master’s degree in dance from ASU - Tempe. This makes it the #14 most popular school for dance master’s degree candidates in the country.
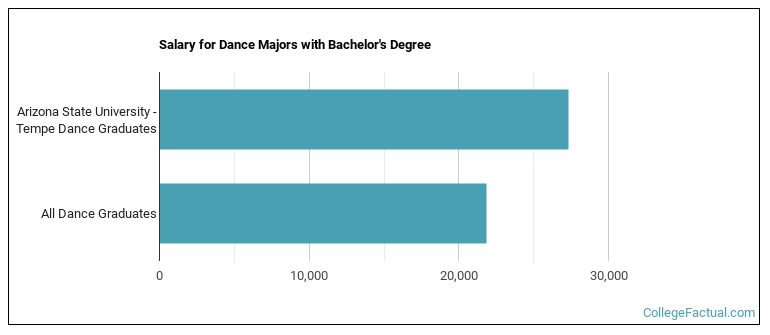
Dance majors who earn their bachelor's degree from ASU - Tempe go on to jobs where they make a median salary of $27,310 a year. This is great news for graduates of the program, since this figure is higher than the national average of $21,879 for all dance bachelor's degree recipients.
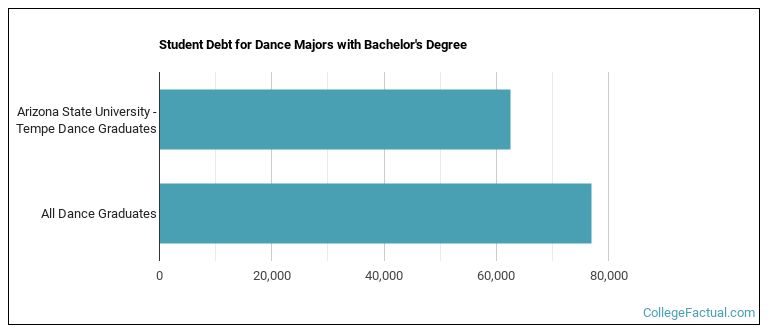
While getting their bachelor's degree at ASU - Tempe, dance students borrow a median amount of $62,547 in student loans. This is not too bad considering that the median debt load of all dance bachelor's degree recipients across the country is $76,973.
Out-of-state part-time undergraduates at ASU - Tempe paid an average of $1,310 per credit hour in 2022-2023. The average for in-state students was $808 per credit hour. Information about average full-time undergraduate tuition and fees is shown in the table below.
| In State | Out of State | |
|---|---|---|
| Tuition | $11,308 | $31,450 |
| Fees | $743 | $743 |
| Books and Supplies | $1,320 | $1,320 |
| On Campus Room and Board | $16,091 | $16,091 |
| On Campus Other Expenses | $3,808 | $3,808 |
Learn more about ASU - Tempe tuition and fees.
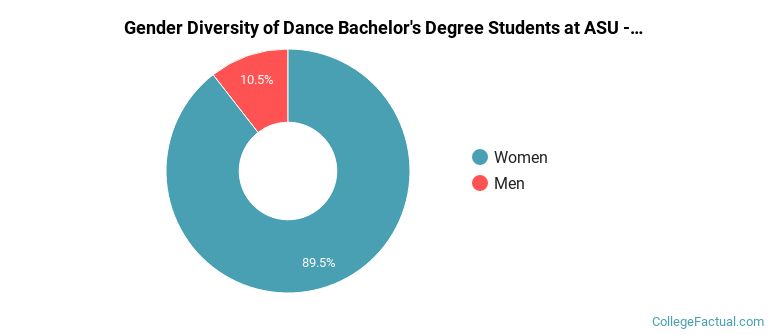
For the most recent academic year available, 11% of dance bachelor's degrees went to men and 89% went to women.
The following table and chart show the ethnic background for students who recently graduated from Arizona State University - Tempe with a bachelor's in dance.
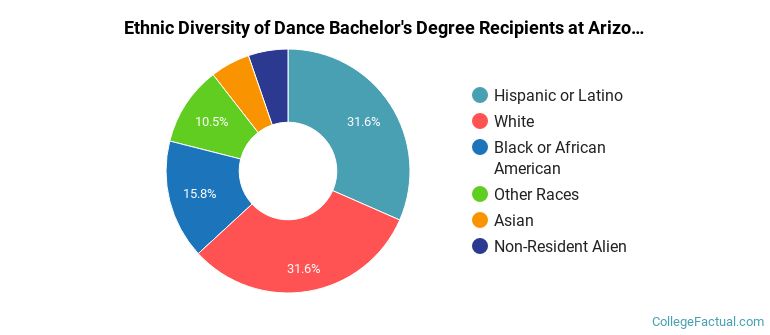
| Ethnic Background | Number of Students |
|---|---|
| Asian | 1 |
| Black or African American | 3 |
| Hispanic or Latino | 6 |
| White | 6 |
| Non-Resident Aliens | 1 |
| Other Races | 2 |
ASU - Tempe does not offer an online option for its dance bachelor’s degree program at this time. To see if the school offers distance learning options in other areas, visit the ASU - Tempe Online Learning page.
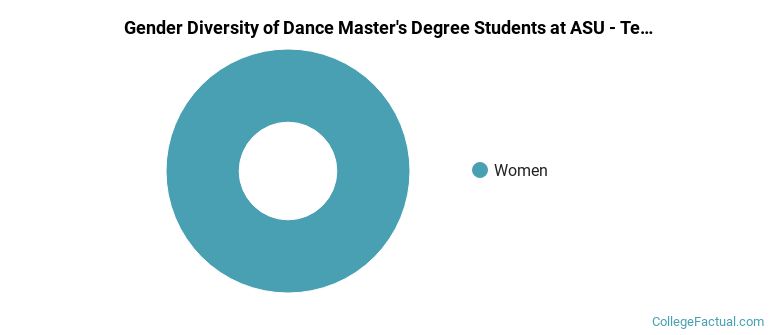
All of the 3 students who graduated with a Master’s in dance from ASU - Tempe in 2022 were women.
The following table and chart show the ethnic background for students who recently graduated from Arizona State University - Tempe with a master's in dance.
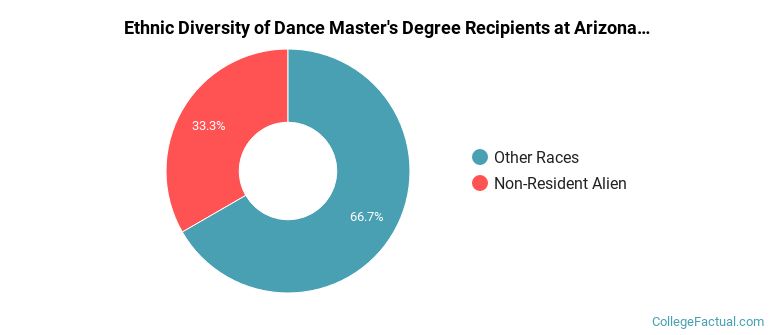
| Ethnic Background | Number of Students |
|---|---|
| Asian | 0 |
| Black or African American | 0 |
| Hispanic or Latino | 0 |
| White | 0 |
| Non-Resident Aliens | 1 |
| Other Races | 2 |
Take a look at the following statistics related to the make-up of the dance majors at Arizona State University - Tempe.
| Related Major | Annual Graduates |
|---|---|
| Design & Applied Arts | 199 |
| Fine & Studio Arts | 186 |
| Film, Video & Photographic Arts | 166 |
| Music | 124 |
| Drama & Theater Arts | 65 |
More about our data sources and methodologies.