Go directly to any of the following sections:
The bachelor's program at A-State was ranked #448 on College Factual's Best Schools for social sciences list. It is also ranked #2 in Arkansas.
| Ranking Type | Rank |
|---|---|
| Best Social Sciences Bachelor’s Degree Schools | 426 |
| Best Social Sciences Schools | 448 |
During the 2021-2022 academic year, Arkansas State University - Main Campus handed out 117 bachelor's degrees in social sciences. This is a decrease of 1% over the previous year when 118 degrees were handed out.
In 2022, 7 students received their master’s degree in social sciences from A-State. This makes it the #322 most popular school for social sciences master’s degree candidates in the country.
Out-of-state part-time undergraduates at A-State paid an average of $552 per credit hour in 2022-2023. The average for in-state students was $299 per credit hour. The average full-time tuition and fees for undergraduates are shown in the table below.
| In State | Out of State | |
|---|---|---|
| Tuition | $7,176 | $13,248 |
| Fees | $578 | $578 |
| Books and Supplies | $1,250 | $1,250 |
| On Campus Room and Board | $11,100 | $11,100 |
| On Campus Other Expenses | $6,122 | $6,122 |
Learn more about A-State tuition and fees.
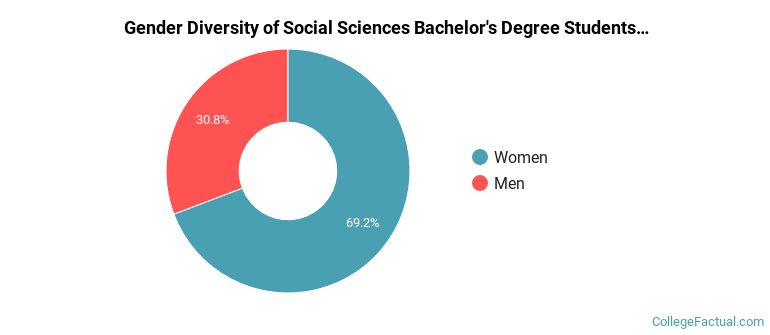
During the 2021-2022 academic year, 117 students graduated with a bachelor's degree in social sciences from A-State. About 31% were men and 69% were women.
The majority of bachelor's degree recipients in this major at A-State are white. In the most recent graduating class for which data is available, 73% of students fell into this category.
The following table and chart show the ethnic background for students who recently graduated from Arkansas State University - Main Campus with a bachelor's in social sciences.
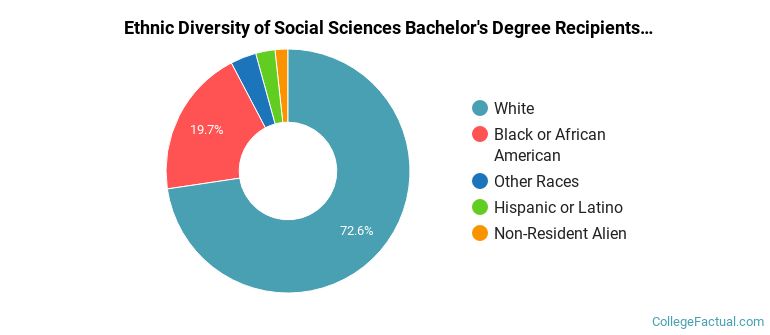
| Ethnic Background | Number of Students |
|---|---|
| Asian | 0 |
| Black or African American | 23 |
| Hispanic or Latino | 3 |
| White | 85 |
| Non-Resident Aliens | 2 |
| Other Races | 4 |
Looking for online learning options? Good news, you can take online classes in the social sciences bachelor’s degree program at A-State. To see if the school offers distance learning options in other areas, visit the A-State Online Learning page.
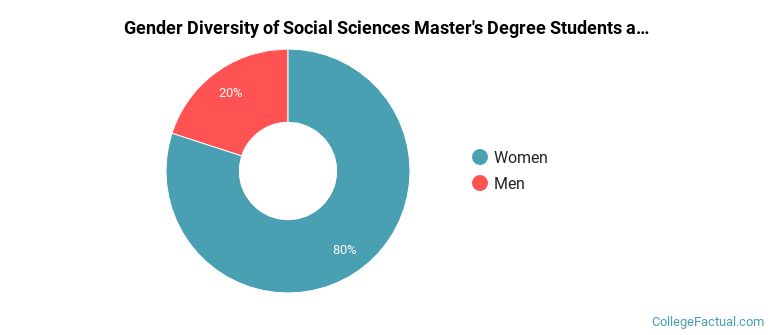
During the 2021-2022 academic year, 5 social sciences majors earned their master's degree from A-State. Of these graduates, 20% were men and 80% were women.
The majority of master's degree recipients in this major at A-State are white. In the most recent graduating class for which data is available, 60% of students fell into this category.
The following table and chart show the ethnic background for students who recently graduated from Arkansas State University - Main Campus with a master's in social sciences.
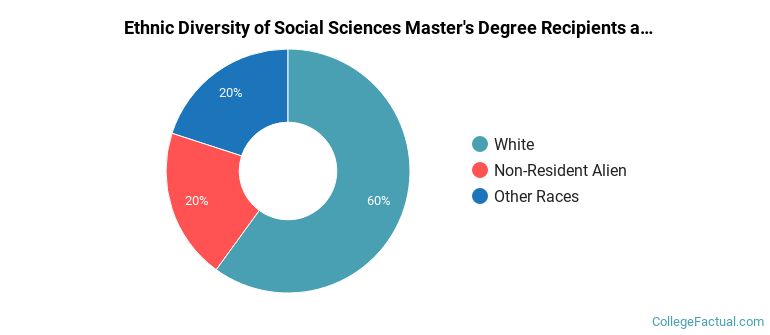
| Ethnic Background | Number of Students |
|---|---|
| Asian | 0 |
| Black or African American | 0 |
| Hispanic or Latino | 0 |
| White | 3 |
| Non-Resident Aliens | 1 |
| Other Races | 1 |
Take a look at the following statistics related to the make-up of the social sciences majors at Arkansas State University - Main Campus.
Social Sciences students may decide to major in one of the following focus areas. Individual majors may not be available for all degree levels.
| Major | Annual Graduates |
|---|---|
| Sociology | 35 |
| Political Science & Government | 31 |
| Economics | 8 |
| Related Major | Annual Graduates |
|---|---|
| Liberal Arts / Sciences & Humanities | 777 |
| Communication & Journalism | 232 |
| Family, Consumer & Human Sciences | 27 |
| English Language & Literature | 26 |
| History | 14 |
More about our data sources and methodologies.