Explore the best ranked schools for the programs you are most interested in.
According to College Factual's 2025 analysis, Assumption is ranked #937 out of 2,152 schools in the nation that were analyzed for overall quality. This is an improvement over the previous year, when Assumption held the #1,054 spot on the Best Overall Colleges list.
Out of the 63 colleges in Massachusetts, Assumption is ranked at #48.
When it comes to admittance, Assumption University is somewhat selective. Its acceptance rate is 82%, which means you'll face some strong competition during the admissions process. Do what you can to make your application stand out.
The student to faculty ratio at Assumption is an impressive 11 to 1. That's quite good when you compare it to the national average of 15 to 1. This is a good sign that students at the school will have more opportunities for one-on-one interactions with their professors.
In addition to the student to faculty ratio, some people look at what percentage of faculty members are full-time as a sign of how much time professors will be able to spend with their students. This is because part-time teachers may not be be on campus as much as their full-time counterparts.
The full-time faculty percentage at Assumption University is 53%. This is higher than the national average of 47%.
Assumption University has a freshmen retention rate of 83%. That's a good sign that full-time students like the school and their professors enough to want to stick around for another year. It's also a sign that the admissions team did a good job in choosing applicants who were a good fit for the school.
The on-time graduation rate for someone pursuing a bachelor's degree is typically four years. This rate at Assumption for first-time, full-time students is 70%, which is better than the national average of 33.3%.
Find out more about the retention and graduation rates at Assumption University.
During the 2017-2018 academic year, there were 2,027 undergraduates at Assumption with 1,970 being full-time and 57 being part-time.
| $0-30 K | $30K-48K | $48-75 | $75-110K | $110K + |
|---|---|---|---|---|
| $19,271 | $19,262 | $26,337 | $29,121 | $31,485 |
The net price is calculated by adding tuition, room, board and other costs and subtracting financial aid.Note that the net price is typically less than the published for a school. For more information on the sticker price of Assumption, see our tuition and fees and room and board pages.
Almost 66% of college students who graduated with the class of 2018 took out student loans, but that percentage varies from school to school. At Assumption, approximately 94% of students took out student loans averaging $9,039 a year. That adds up to $36,156 over four years for those students.
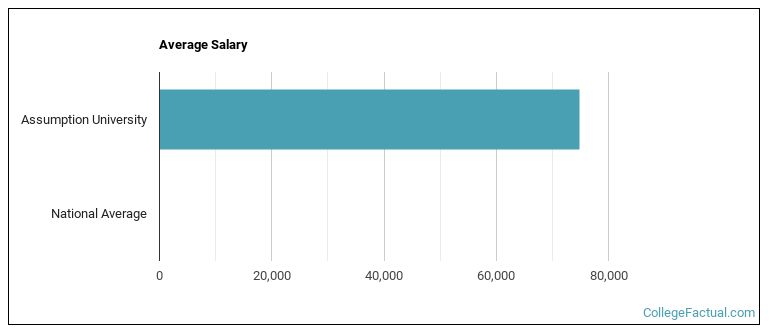
See which majors at Assumption University make the most money.
Get more details about the location of Assumption University.

Contact details for Assumption are given below.
| Contact Details | |
|---|---|
| Address: | 500 Salisbury St, Worcester, MA 01609-1296 |
| Phone: | 508-767-7000 |
| Website: | https://www.assumption.edu/ |
| Most Popular Majors | Bachelor’s Degrees | Average Salary of Graduates |
|---|---|---|
| Business Administration & Management | 121 | $56,211 |
| Rehabilitation & Therapeutic Professions | 55 | $38,094 |
| Marketing | 48 | $55,314 |
| Accounting | 44 | $67,012 |
| Health Sciences & Services | 35 | NA |
| General Psychology | 35 | $38,697 |
| Teacher Education Grade Specific | 34 | $48,641 |
| Student Counseling | 33 | NA |
| General English Literature | 26 | $34,206 |
| Clinical, Counseling & Applied Psychology | 26 | NA |
Online learning options are becoming more and more popular at American colleges and universities. Online classes are great for students who have busy schedules or for those who just want to study on their own time.
In 2022-2023, 250 students took at least one online class at Assumption University. This is a decrease from the 287 students who took online classes the previous year.
| Year | Took at Least One Online Class | Took All Classes Online |
|---|---|---|
| 2022-2023 | 250 | 185 |
| 2021-2022 | 287 | 187 |
| 2020-2021 | 2,448 | 2,448 |
| 2018-2019 | 272 | 161 |
Footnotes
*The racial-ethnic minorities count is calculated by taking the total number of students and subtracting white students, international students, and students whose race/ethnicity was unknown. This number is then divided by the total number of students at the school to obtain the racial-ethnic minorities percentage.
References
More about our data sources and methodologies.