We've pulled together some essential information you should know about the program, including how many students graduate each year, the ethnic diversity of these students, and more. Also, learn how Baldwin Wallace College ranks among other schools offering degrees in music.
Jump to any of the following sections:
Learn about start dates, transferring credits, availability of financial aid, and more by contacting the universities below.
Earn the music business degree that fits into the business world – and partners Southern New Hampshire University with world-renowned Berklee College of Music.
The bachelor's program at Baldwin Wallace College was ranked #156 on College Factual's Best Schools for music list. It is also ranked #10 in Ohio.
| Ranking Type | Rank |
|---|---|
| Best Music Schools | 156 |
| Best Music Bachelor’s Degree Schools | 156 |
During the 2021-2022 academic year, Baldwin Wallace University handed out 30 bachelor's degrees in music. This is a decrease of 23% over the previous year when 39 degrees were handed out.
In 2022-2023, the average part-time undergraduate tuition at Baldwin Wallace College was $1,003 per credit hour for both in-state and out-of-state students. Information about average full-time undergraduate tuition and fees is shown in the table below.
| In State | Out of State | |
|---|---|---|
| Tuition | $37,686 | $37,686 |
| Fees | $400 | $400 |
| Books and Supplies | $1,500 | $1,500 |
| On Campus Room and Board | $13,180 | $13,180 |
| On Campus Other Expenses | $6,340 | $6,340 |
Learn more about Baldwin Wallace College tuition and fees.
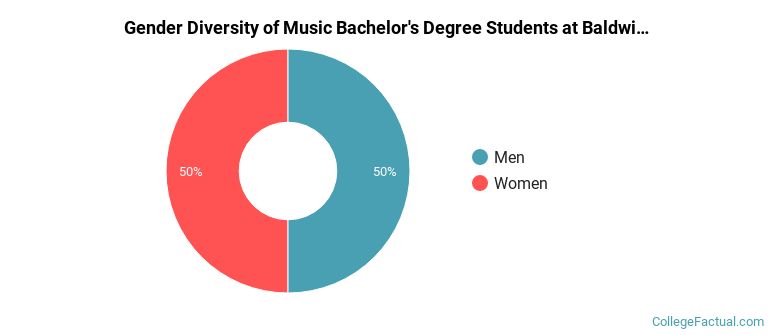
The music program at Baldwin Wallace College awarded 30 bachelor's degrees in 2021-2022. About 50% of these degrees went to men with the other 50% going to women.
The majority of bachelor's degree recipients in this major at Baldwin Wallace College are white. In the most recent graduating class for which data is available, 90% of students fell into this category.
The following table and chart show the ethnic background for students who recently graduated from Baldwin Wallace University with a bachelor's in music.
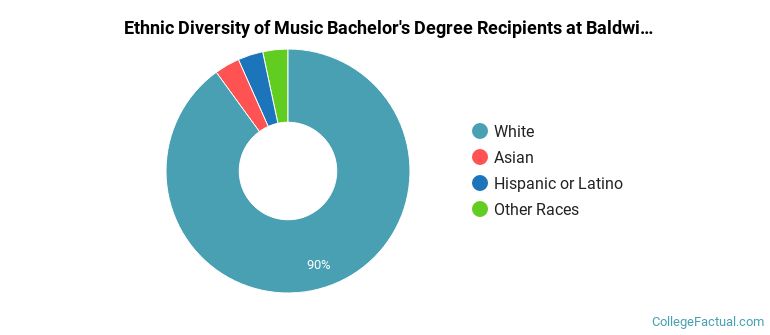
| Ethnic Background | Number of Students |
|---|---|
| Asian | 1 |
| Black or African American | 0 |
| Hispanic or Latino | 1 |
| White | 27 |
| Non-Resident Aliens | 0 |
| Other Races | 1 |
Baldwin Wallace College does not offer an online option for its music bachelor’s degree program at this time. To see if the school offers distance learning options in other areas, visit the Baldwin Wallace College Online Learning page.
Take a look at the following statistics related to the make-up of the music majors at Baldwin Wallace University.
| Related Major | Annual Graduates |
|---|---|
| Drama & Theater Arts | 31 |
| Arts & Media Management | 16 |
| Other Visual Art | 16 |
| Design & Applied Arts | 14 |
| Film, Video & Photographic Arts | 9 |
More about our data sources and methodologies.
