Here, you'll find out more about the major, including such details as the number of graduates, what degree levels are offered, ethnicity of students, average salaries, and more. We've also included details on how Belmont ranks compared to other colleges offering a major in music.
Go directly to any of the following sections:
Learn about start dates, transferring credits, availability of financial aid, and more by contacting the universities below.
Earn the music business degree that fits into the business world – and partners Southern New Hampshire University with world-renowned Berklee College of Music.
In College Factual's most recent rankings for the best schools for music majors, Belmont came in at #15. This puts it in the top 5% of the country in this field of study. It is also ranked #2 in Tennessee.
| Ranking Type | Rank |
|---|---|
| Best Music Bachelor’s Degree Schools | 12 |
| Best Music Schools | 15 |
| Best Music Master’s Degree Schools | 27 |
| Best Music Graduate Degree Schools | 29 |
During the 2021-2022 academic year, Belmont University handed out 94 bachelor's degrees in music. This is a decrease of 5% over the previous year when 99 degrees were handed out.
In 2022, 14 students received their master’s degree in music from Belmont. This makes it the #119 most popular school for music master’s degree candidates in the country.
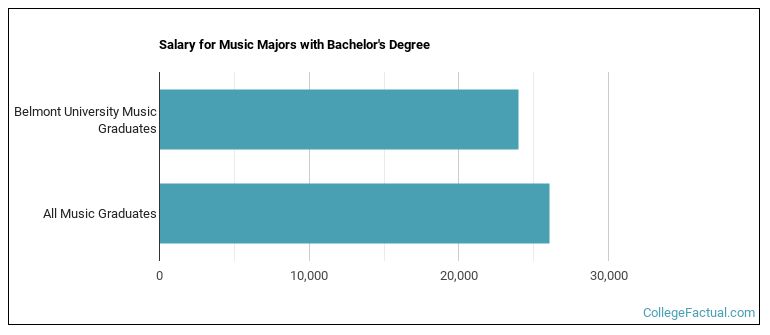
The median salary of music students who receive their bachelor's degree at Belmont is $24,016. Unfortunately, this is lower than the national average of $26,036 for all music students.
The typical student loan payment of a bachelor's degree student from the music program at Belmont is $870 per month.
During the 2022-2023 academic year, part-time undergraduate students at Belmont paid an average of $1,485 per credit hour. No discount was available for in-state students. Information about average full-time undergraduate tuition and fees is shown in the table below.
| In State | Out of State | |
|---|---|---|
| Tuition | $39,400 | $39,400 |
| Fees | $1,920 | $1,920 |
| Books and Supplies | $1,400 | $1,400 |
| On Campus Room and Board | $14,290 | $14,290 |
| On Campus Other Expenses | $5,560 | $5,560 |
Learn more about Belmont tuition and fees.
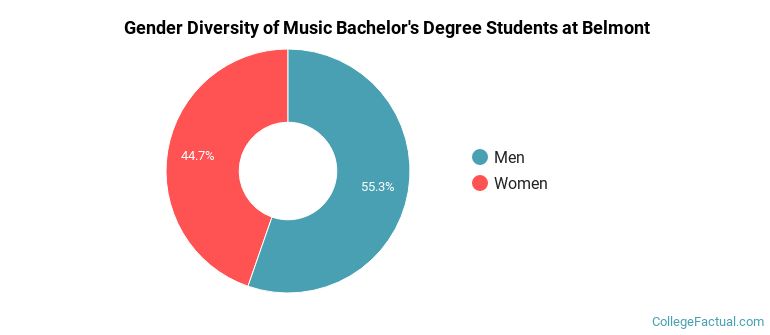
Of the 94 music students who graduated with a bachelor's degree in 2021-2022 from Belmont, about 55% were men and 45% were women.
The majority of the students with this major are white. About 89% of 2022 graduates were in this category.
The following table and chart show the ethnic background for students who recently graduated from Belmont University with a bachelor's in music.
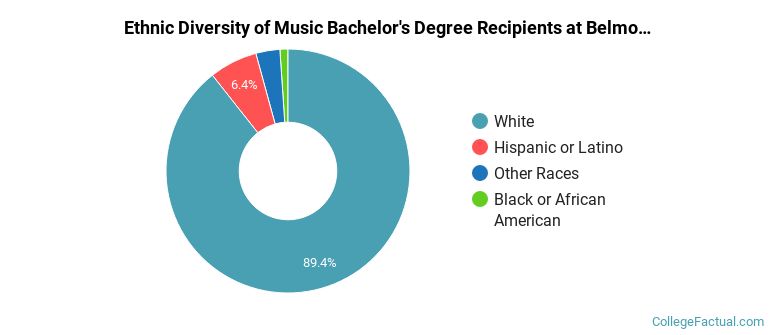
| Ethnic Background | Number of Students |
|---|---|
| Asian | 0 |
| Black or African American | 1 |
| Hispanic or Latino | 6 |
| White | 84 |
| Non-Resident Aliens | 0 |
| Other Races | 3 |
Online degrees for the Belmont music bachelor’s degree program are not available at this time. To see if the school offers distance learning options in other areas, visit the Belmont Online Learning page.
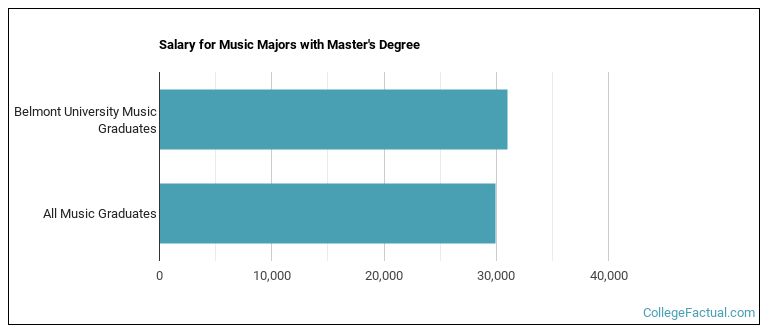
Music majors graduating with a master's degree from Belmont make a median salary of $31,018 a year. This is a better than average outcome since the median salary for all music graduates with a master's is $29,974.
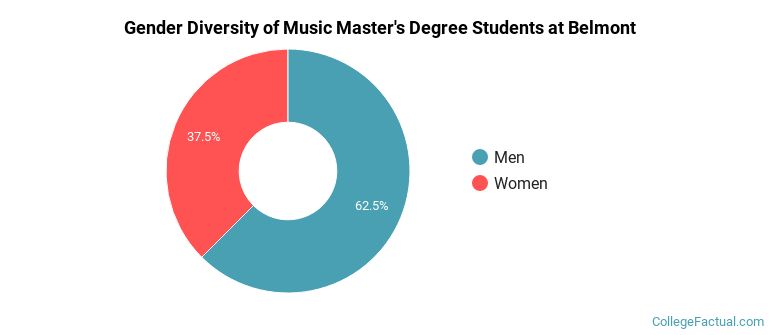
During the 2021-2022 academic year, 24 music majors earned their master's degree from Belmont. Of these graduates, 63% were men and 38% were women.
The majority of the students with this major are white. About 75% of 2022 graduates were in this category.
The following table and chart show the ethnic background for students who recently graduated from Belmont University with a master's in music.
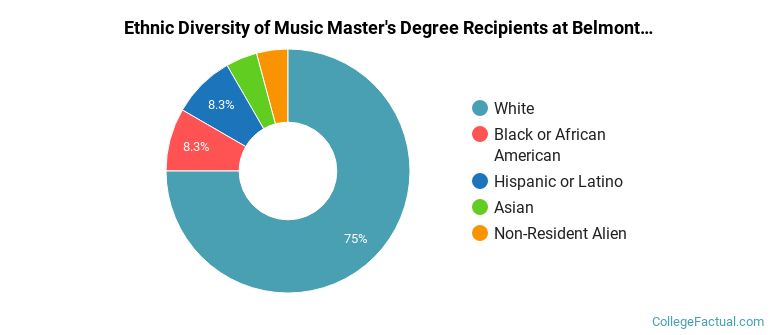
| Ethnic Background | Number of Students |
|---|---|
| Asian | 1 |
| Black or African American | 2 |
| Hispanic or Latino | 2 |
| White | 18 |
| Non-Resident Aliens | 1 |
| Other Races | 0 |
Take a look at the following statistics related to the make-up of the music majors at Belmont University.
| Related Major | Annual Graduates |
|---|---|
| Arts & Media Management | 411 |
| Film, Video & Photographic Arts | 47 |
| Design & Applied Arts | 43 |
| Drama & Theater Arts | 22 |
| Fine & Studio Arts | 15 |
More about our data sources and methodologies.
