Go directly to any of the following sections:
Learn about start dates, transferring credits, availability of financial aid, and more by contacting the universities below.
Explore societal similarities and differences as seen through cultural, biological, archaeological and linguistic lenses when you earn one of your degrees in anthropology from Southern New Hampshire University.
Gain a rich foundation of knowledge ranging from early history to modern times with this online bachelor's degree in history from Southern New Hampshire University.
The online Master of Arts in History degree program can deepen your understanding of how history is made.
The area, ethnic, culture, & gender studies major at Boston U is not ranked on College Factual’s Best Colleges and Universities for Area, Ethnic, Culture, & Gender Studies. This could be for a number of reasons, such as not having enough data on the major or school to make an accurate assessment of its quality.
During the 2021-2022 academic year, Boston University handed out 12 bachelor's degrees in area, ethnic, culture, & gender studies. This is a decrease of 20% over the previous year when 15 degrees were handed out.
In 2022, 6 students received their master’s degree in area, ethnic, culture, & gender studies from Boston U. This makes it the #65 most popular school for area, ethnic, culture, & gender studies master’s degree candidates in the country.
In addition, 4 students received their doctoral degrees in area, ethnic, culture, & gender studies in 2022, making the school the #20 most popular school in the United States for this category of students.
During the 2022-2023 academic year, part-time undergraduate students at Boston U paid an average of $1,994 per credit hour. No discount was available for in-state students. The following table shows the average full-time tuition and fees for undergraduates.
| In State | Out of State | |
|---|---|---|
| Tuition | $63,798 | $63,798 |
| Fees | $1,370 | $1,370 |
| Books and Supplies | $1,000 | $1,000 |
| On Campus Room and Board | $18,110 | $18,110 |
| On Campus Other Expenses | $2,085 | $2,085 |
Learn more about Boston U tuition and fees.
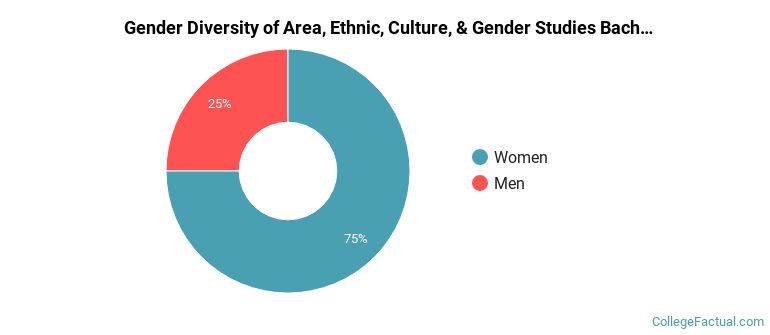
In the 2021-2022 academic year, 12 students earned a bachelor's degree in area, ethnic, culture, & gender studies from Boston U. About 75% of these graduates were women and the other 25% were men.
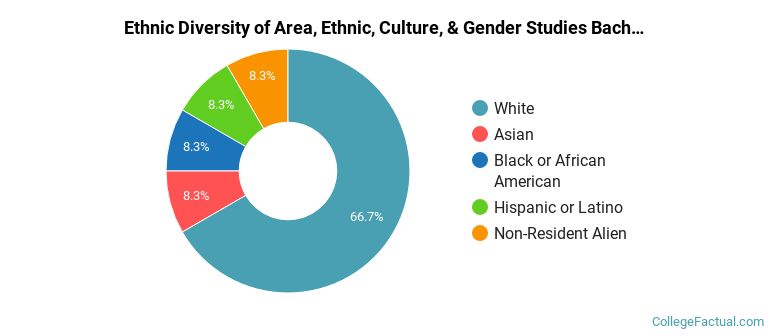
The majority of the students with this major are white. About 67% of 2022 graduates were in this category.
The following table and chart show the ethnic background for students who recently graduated from Boston University with a bachelor's in area, ethnic, culture, & gender studies.
| Ethnic Background | Number of Students |
|---|---|
| Asian | 1 |
| Black or African American | 1 |
| Hispanic or Latino | 1 |
| White | 8 |
| Non-Resident Aliens | 1 |
| Other Races | 0 |
Boston U does not offer an online option for its area, ethnic, culture, & gender studies bachelor’s degree program at this time. To see if the school offers distance learning options in other areas, visit the Boston U Online Learning page.
All of the 2 students who graduated with a Master’s in area, ethnic, culture, & gender studies from Boston U in 2022 were women.

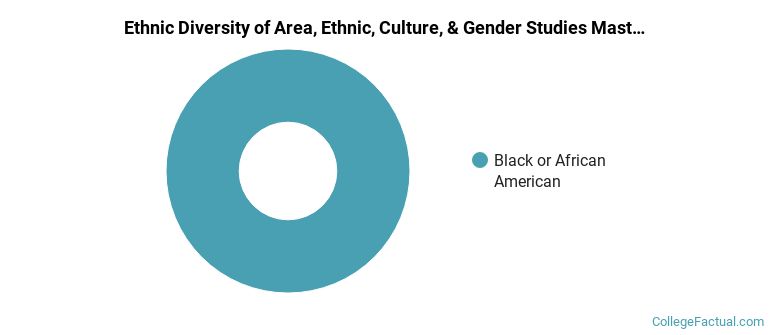
The majority of the master's degree graduates for this major are black or African Americans. About 100% of grads fell into this category.
The following table and chart show the ethnic background for students who recently graduated from Boston University with a master's in area, ethnic, culture, & gender studies.
| Ethnic Background | Number of Students |
|---|---|
| Asian | 0 |
| Black or African American | 2 |
| Hispanic or Latino | 0 |
| White | 0 |
| Non-Resident Aliens | 0 |
| Other Races | 0 |
Take a look at the following statistics related to the make-up of the area, ethnic, culture, & gender studies majors at Boston University.
Area, Ethnic, Culture, & Gender Studies students may decide to major in one of the following focus areas. Individual majors may not be available for all degree levels.
| Major | Annual Graduates |
|---|---|
| Area Studies | 25 |
| Ethnic Studies | 1 |
| Related Major | Annual Graduates |
|---|---|
| Social Sciences | 1,123 |
| Communication & Journalism | 1,023 |
| English Language & Literature | 124 |
| Theology & Religious Vocations | 98 |
| Foreign Languages & Linguistics | 94 |
View All Area, Ethnic, Culture, & Gender Studies Related Majors >
More about our data sources and methodologies.
