Go directly to any of the following sections:
In College Factual's most recent rankings for the best schools for visual & performing arts majors, Boston U came in at #21. This puts it in the top 5% of the country in this field of study. It is also ranked #1 in Massachusetts.
During the 2021-2022 academic year, Boston University handed out 162 bachelor's degrees in visual & performing arts. This is a decrease of 13% over the previous year when 187 degrees were handed out.
In 2022, 118 students received their master’s degree in visual & performing arts from Boston U. This makes it the #26 most popular school for visual & performing arts master’s degree candidates in the country.
In addition, 32 students received their doctoral degrees in visual & performing arts in 2022, making the school the #13 most popular school in the United States for this category of students.
Part-time undergraduates at Boston U paid an average of $1,994 per credit hour in 2022-2023. This tuition was the same for both in-state and out-of-state students. The following table shows the average full-time tuition and fees for undergraduates.
| In State | Out of State | |
|---|---|---|
| Tuition | $63,798 | $63,798 |
| Fees | $1,370 | $1,370 |
| Books and Supplies | $1,000 | $1,000 |
| On Campus Room and Board | $18,110 | $18,110 |
| On Campus Other Expenses | $2,085 | $2,085 |
Learn more about Boston U tuition and fees.
Of the 162 students who earned a bachelor's degree in Visual & Performing Arts from Boston U in 2021-2022, 27% were men and 73% were women.

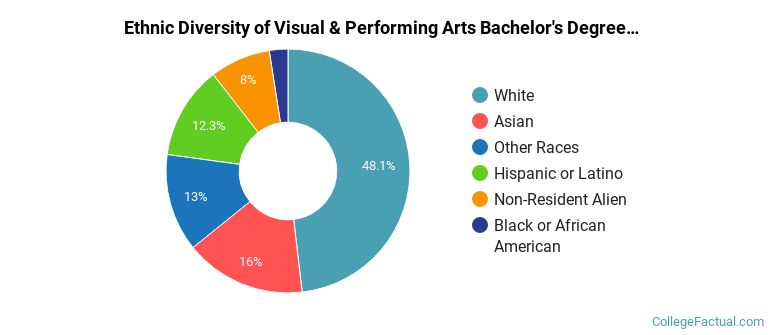
The following table and chart show the ethnic background for students who recently graduated from Boston University with a bachelor's in visual & performing arts.
| Ethnic Background | Number of Students |
|---|---|
| Asian | 26 |
| Black or African American | 4 |
| Hispanic or Latino | 20 |
| White | 78 |
| Non-Resident Aliens | 13 |
| Other Races | 21 |
Boston U does not offer an online option for its visual & performing arts bachelor’s degree program at this time. To see if the school offers distance learning options in other areas, visit the Boston U Online Learning page.
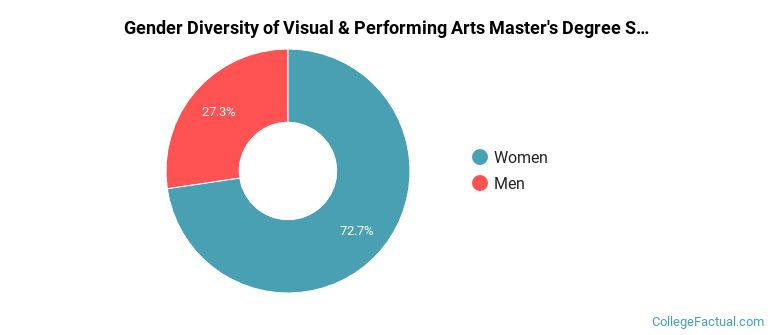
During the 2021-2022 academic year, 150 students graduated with a master's degree in visual & performing arts from Boston U. About 27% were men and 73% were women.
The following table and chart show the ethnic background for students who recently graduated from Boston University with a master's in visual & performing arts.

| Ethnic Background | Number of Students |
|---|---|
| Asian | 7 |
| Black or African American | 3 |
| Hispanic or Latino | 8 |
| White | 68 |
| Non-Resident Aliens | 55 |
| Other Races | 9 |
Take a look at the following statistics related to the make-up of the visual & performing arts majors at Boston University.
Visual & Performing Arts students may decide to major in one of the following focus areas. Individual majors may not be available for all degree levels.
| Major | Annual Graduates |
|---|---|
| Music | 126 |
| Drama & Theater Arts | 76 |
| Fine & Studio Arts | 72 |
| Design & Applied Arts | 42 |
| Arts & Media Management | 33 |
| Other Visual Art | 12 |
| Film, Video & Photographic Arts | 2 |
| General Visual & Performing Arts | 1 |
More about our data sources and methodologies.