Explore the best ranked schools for the programs you are most interested in.
College Factual ranked Brescia University as #1,568 out of 2,152 colleges and universities in the country on its 2025 Best Colleges list.
Out of the 39 colleges in Kentucky, Brescia University is ranked at #18.
If you're applying to Brescia University you'll face some tough competition, since the school's acceptance rate is only 50%. Definitely don't wait until the last minute to submit your application, since applying early may be in your favor.
About 1% of students accepted to Brescia University submitted their SAT scores.Brescia University received ACT scores from 2% of accepted students.
The student to faculty ratio is often used to measure the number of teaching resources that a college or university offers its students. The national average for this metric is 15 to 1, but at Brescia University it is much better at 9 to 1. That's good news for students who want to interact more on a personal level with their teachers.
In addition to the student to faculty ratio, some people look at what percentage of faculty members are full-time as a sign of how much time professors will be able to spend with their students. This is because part-time teachers may not be be on campus as much as their full-time counterparts.
The full-time faculty percentage at Brescia University is 44%. This is comparable to the national average of 47%.
Brescia University has a freshmen retention rate of 77%. That's a good sign that full-time students like the school and their professors enough to want to stick around for another year. It's also a sign that the admissions team did a good job in choosing applicants who were a good fit for the school.
When we say that a student has graduated on time, we mean that they have finished their bachelor's degree within four years. The on-time graduation rate at Brescia University is 26%. That's lower than the national rate of 33.3%
Find out more about the retention and graduation rates at Brescia University.
During the 2017-2018 academic year, there were 893 undergraduates at Brescia University with 711 being full-time and 182 being part-time.
| $0-30 K | $30K-48K | $48-75 | $75-110K | $110K + |
|---|---|---|---|---|
| $16,232 | $12,346 | $15,209 | $18,501 | $20,434 |
The net price is calculated by adding tuition, room, board and other costs and subtracting financial aid.Note that the net price is typically less than the published for a school. For more information on the sticker price of Brescia University, see our tuition and fees and room and board pages.
Almost 66% of college students who graduated with the class of 2018 took out student loans, but that percentage varies from school to school. At Brescia University, approximately 48% of students took out student loans averaging $5,856 a year. That adds up to $23,424 over four years for those students.
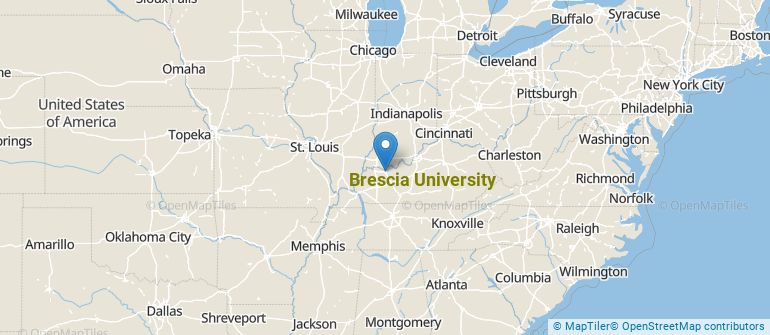
Get more details about the location of Brescia University.
Contact details for Brescia University are given below.
| Contact Details | |
|---|---|
| Address: | 717 Frederica St, Owensboro, KY 42301-3023 |
| Phone: | 270-685-3131 |
| Website: | www.brescia.edu/ |
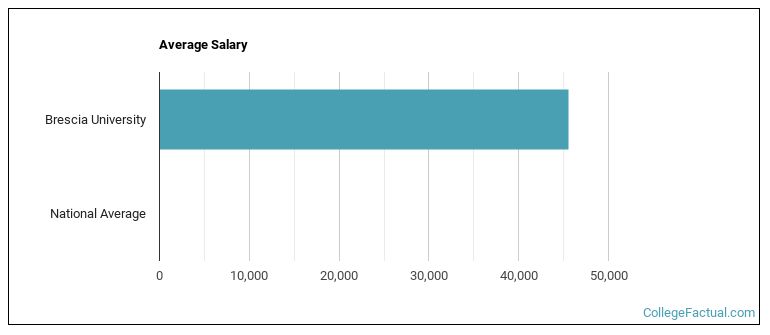
| Most Popular Majors | Bachelor’s Degrees | Average Salary of Graduates |
|---|---|---|
| Social Work | 79 | $37,841 |
| General Psychology | 36 | $22,619 |
| General Business/Commerce | 35 | NA |
| Accounting | 14 | NA |
| General Biology | 11 | NA |
| Liberal Arts General Studies | 10 | NA |
| Business Administration & Management | 7 | $42,269 |
| Teacher Education Grade Specific | 6 | NA |
| Communication Sciences | 6 | NA |
| Computer Information Systems | 5 | NA |
Online learning options are becoming more and more popular at American colleges and universities. Online classes are great for students who have busy schedules or for those who just want to study on their own time.
In 2022-2023, 457 students took at least one online class at Brescia University. This is a decrease from the 594 students who took online classes the previous year.
| Year | Took at Least One Online Class | Took All Classes Online |
|---|---|---|
| 2022-2023 | 457 | 241 |
| 2021-2022 | 594 | 293 |
| 2020-2021 | 483 | 356 |
| 2018-2019 | 443 | 443 |
Footnotes
*The racial-ethnic minorities count is calculated by taking the total number of students and subtracting white students, international students, and students whose race/ethnicity was unknown. This number is then divided by the total number of students at the school to obtain the racial-ethnic minorities percentage.
References
More about our data sources and methodologies.