We've pulled together some essential information you should know about the program, including how many students graduate each year, the ethnic diversity of these students, and more. Also, learn how BridgeValley Community & Technical College ranks among other schools offering degrees in medical assisting.
Jump to any of the following sections:
The medical assisting major at BridgeValley Community & Technical College is not ranked on College Factual’s Best Colleges and Universities for Allied Health & Medical Assisting Services. This could be for a number of reasons, such as not having enough data on the major or school to make an accurate assessment of its quality.
Out-of-state part-time undergraduates at BridgeValley Community & Technical College paid an average of $465 per credit hour in 2022-2023. The average for in-state students was $195 per credit hour. The following table shows the average full-time tuition and fees for undergraduates.
| In State | Out of State | |
|---|---|---|
| Tuition | $4,682 | $11,148 |
| Fees | $600 | $600 |
| Books and Supplies | $1,672 | $1,672 |
Learn more about BridgeValley Community & Technical College tuition and fees.
BridgeValley Community & Technical College does not offer an online option for its medical assisting bachelor’s degree program at this time. To see if the school offers distance learning options in other areas, visit the BridgeValley Community & Technical College Online Learning page.
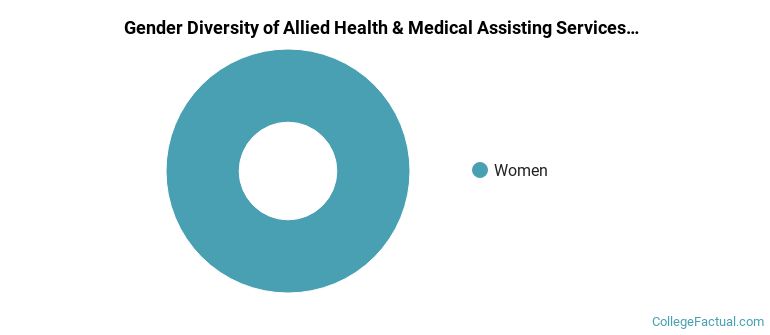
All of the 3 students who graduated with a Associate’s in medical assisting from BridgeValley Community & Technical College in 2022 were women.
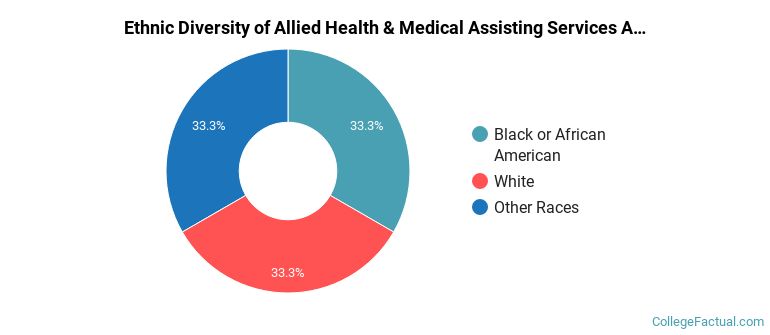
The following table and chart show the ethnic background for students who recently graduated from BridgeValley Community & Technical College with a associate's in medical assisting.
| Ethnic Background | Number of Students |
|---|---|
| Asian | 0 |
| Black or African American | 1 |
| Hispanic or Latino | 0 |
| White | 1 |
| Non-Resident Aliens | 0 |
| Other Races | 1 |
| Related Major | Annual Graduates |
|---|---|
| Nursing | 67 |
| Allied Health Professions | 30 |
| Dental Support Services | 14 |
| Mental & Social Health Services | 11 |
| Health & Medical Administrative Services | 9 |
View All Allied Health & Medical Assisting Services Related Majors >