Explore the best ranked schools for the programs you are most interested in.
College Factual ranked BridgeValley Community & Technical College as #1,931 out of 2,152 colleges and universities in the country on its 2025 Best Colleges list.
BridgeValley Community & Technical College also holds the #17 spot on the Best Colleges in West Virginia ranking.
See all of the rankings for BridgeValley Community & Technical College.
As long as you meet basic requirements, you should not have any trouble getting into BridgeValley Community & Technical College since the school has an open admissions policy. Still, be sure to submit any requested materials and that your application is completed in full.
The student to faculty ratio is often used to measure the number of teaching resources that a college or university offers its students. The national average for this metric is 15 to 1, but at BridgeValley Community & Technical College it is much better at 11 to 1. That's good news for students who want to interact more on a personal level with their teachers.
Another measure that is often used to estimate how much access students will have to their professors is how many faculty members are full-time. The idea here is that part-time faculty tend to spend less time on campus, so they may not be as available to students as full-timers.
The full-time faculty percentage at BridgeValley Community & Technical College is 57%. This is higher than the national average of 47%.
The freshmen retention rate is a sign of how many full-time students like a college or university well enough to come back for their sophomore year. At BridgeValley Community & Technical College this rate is 54%, which is a bit lower than the national average of 68%.
During the 2017-2018 academic year, there were 1,662 undergraduates at BridgeValley Community & Technical College with 1,040 being full-time and 622 being part-time.
| $0-30 K | $30K-48K | $48-75 | $75-110K | $110K + |
|---|---|---|---|---|
| $7,688 | $8,541 | $8,910 | $10,780 | $9,923 |
The net price is calculated by adding tuition, room, board and other costs and subtracting financial aid.Note that the net price is typically less than the published for a school. For more information on the sticker price of BridgeValley Community & Technical College, see our tuition and fees and room and board pages.
It's not uncommon for college students to take out loans to pay for school. In fact, almost 66% of students nationwide depend at least partially on loans. At BridgeValley Community & Technical College, approximately 21% of students took out student loans averaging $3,284 a year. That adds up to $13,136 over four years for those students.
Get more details about paying for BridgeValley Community & Technical College.
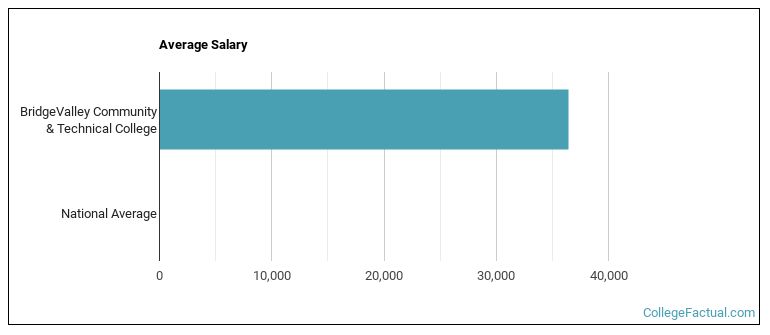
See which majors at BridgeValley Community & Technical College make the most money.
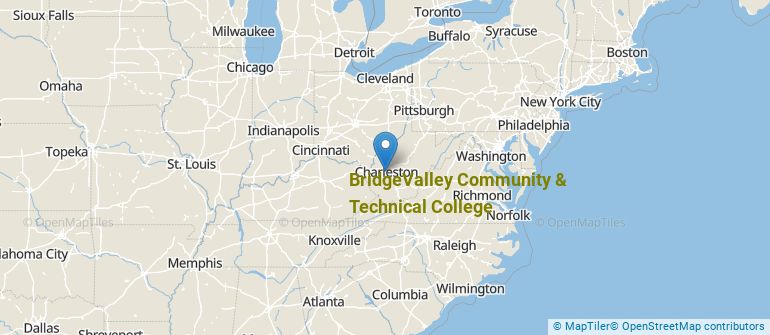
Get more details about the location of BridgeValley Community & Technical College.
Contact details for BridgeValley Community & Technical College are given below.
| Contact Details | |
|---|---|
| Address: | 2001 Union Carbide Dr, South Charleston, WV 25136 |
| Phone: | 304-734-6600 |
| Website: | www.bridgevalley.edu/ |
| Most Popular Majors | Bachelor’s Degrees | Average Salary of Graduates |
|---|---|---|
| Nursing | 67 | NA |
| Allied Health Professions | 30 | NA |
| Liberal Arts General Studies | 26 | NA |
| Physical Science Technicians | 21 | NA |
| Construction Engineering Technology | 18 | NA |
| Information Technology | 16 | NA |
| Electromechanical Engineering Technology | 16 | NA |
| Dental Support Services | 14 | NA |
| Electronics Engineering Technology | 11 | NA |
| Mental & Social Health Services | 11 | NA |
Online learning is becoming popular at even the oldest colleges and universities in the United States. Not only are online classes great for returning adults with busy schedules, they are also frequented by a growing number of traditional students.
In 2022-2023, 1,022 students took at least one online class at BridgeValley Community & Technical College. This is a decrease from the 1,223 students who took online classes the previous year.
| Year | Took at Least One Online Class | Took All Classes Online |
|---|---|---|
| 2022-2023 | 1,022 | 373 |
| 2021-2022 | 1,223 | 198 |
| 2020-2021 | 1,180 | 226 |
| 2018-2019 | 1,066 | 179 |
Learn more about online learning at BridgeValley Community & Technical College.
Footnotes
*The racial-ethnic minorities count is calculated by taking the total number of students and subtracting white students, international students, and students whose race/ethnicity was unknown. This number is then divided by the total number of students at the school to obtain the racial-ethnic minorities percentage.
References
More about our data sources and methodologies.