We’ve pulled together the essential facts you should know about the program at BYU-I. You can study it at the Bachelor’s level. It ranks as high as #1 out of 5 schools (Bachelor’s level) by College Factual. Jump to any of the following sections:
College Factual ranks BYU-I as a strong choice for teacher education subject specific, placing at #344 out of 554 schools nationally.
Here is each degree level offered in teacher education subject specific at BYU-I, along with how many graduates complete each level annually.
| Degree Level | Annual Graduates |
|---|---|
| Bachelor’s | 138 |
In the most recent year for which we have data, Brigham Young University-Idaho conferred 138 bachelor’s degrees in teacher education subject specific.
BYU-I is among the very best schools in the country for teacher education subject specific at the bachelor’s level. Specifically, it ranked #1 out of 5 schools by College Factual.
Teacher Education Subject Specific majors who earn their bachelor’s degree from BYU-I report a median salary of $43,390 a year. This is lower than $46,835, the median for all majors at BYU-I.
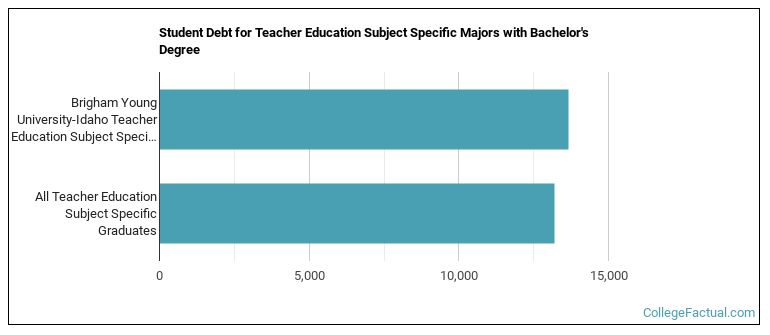
While getting their bachelor’s degree at BYU-I, teacher education subject specific students accumulate a median of $13,680 in student loans. This is above $13,204, the typical median for all majors at BYU-I.
The full-time undergraduate tuition and fees are shown below.
| In State | Out of State | |
|---|---|---|
| Tuition | $4,416 | $4,800 |
Read more about BYU-I tuition and fees.
Among recent graduates, 28% of teacher education subject specific bachelor’s degrees went to men and 72% went to women.
 The majority of teacher education subject specific bachelor’s degree graduates at BYU-I were White. About 80% of graduates fell into this category.
The following table and chart show the ethnic background for students who recently graduated from Brigham Young University-Idaho with a bachelor’s in teacher education subject specific.
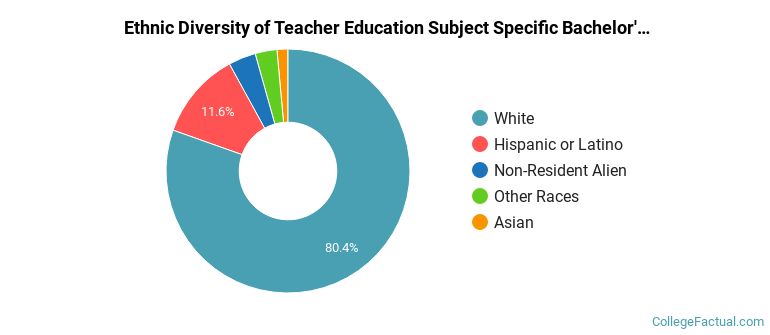
| Ethnic Background | Number of Students |
|---|---|
| Asian | 2 |
| Black or African American | 0 |
| Hispanic or Latino | 16 |
| White | 111 |
| Non-Resident Aliens | 5 |
| Other Races | 4 |
BYU-I awarded 25 bachelor’s degrees in mathematics teacher education recently — 68% to women and 32% to men. Most of these graduates identified as White (72%).
BYU-I granted 22 bachelor’s completions in history teacher education in the latest year of data — 55% to women and 45% to men. The most common background among these graduates was White (86%).
BYU-I awarded 21 bachelor’s completions in english/language arts teacher education recently — 81% to women and 19% to men. The largest share of these graduates were White (86%).
BYU-I conferred 16 bachelor’s completions in music teacher education in the most recent reporting year — 62% to women and 38% to men. Most of these graduates identified as White (81%).
BYU-I conferred 15 bachelor’s completions in spanish language teacher education in the most recent reporting year — 80% to women and 20% to men. The most common background among these graduates was White (53%).
BYU-I granted 13 bachelor’s completions in art teacher education in the most recent reporting year — 100% to women and 0% to men. The largest share of these graduates were White (92%).
BYU-I awarded 11 bachelor’s completions in family and consumer sciences/home economics teacher education in the most recent reporting year — 100% to women and 0% to men. The largest share of these graduates were White (91%).
BYU-I granted 5 bachelor’s completions in biology teacher education in the latest year of data — 60% to women and 40% to men. The most common background among these graduates was White (100%).
BYU-I conferred 4 bachelor’s completions in drama and dance teacher education in the latest year of data — 50% to women and 50% to men. Most of these graduates identified as White (75%).
BYU-I awarded 4 bachelor’s completions in social studies teacher education in the latest year of data — 50% to women and 50% to men. Most of these graduates identified as White (100%).
BYU-I awarded 1 bachelor’s degree in chemistry teacher education in the most recent reporting year — 100% to women and 0% to men. The largest share of these graduates were White (100%).
BYU-I granted 1 bachelor’s degree in physics teacher education in the most recent reporting year — 0% to women and 100% to men. Most of these graduates identified as Hispanic or Latino (100%).
More about our data sources and methodologies.
