How diverse is BYU - I? College Factual’s diversity report brings to light the facts about diversity at BYU - I. We examined racial demographics, gender ratios, student age ranges, and where students come from.
Many schools pride themselves on their diversity, but what does that mean, really? College Factual crunched the numbers to discover how diverse the standard college campus really is, considering race, gender, the ages of the students, and where they’re from.
BYU - I total enrollment is approximately 20,284 students.
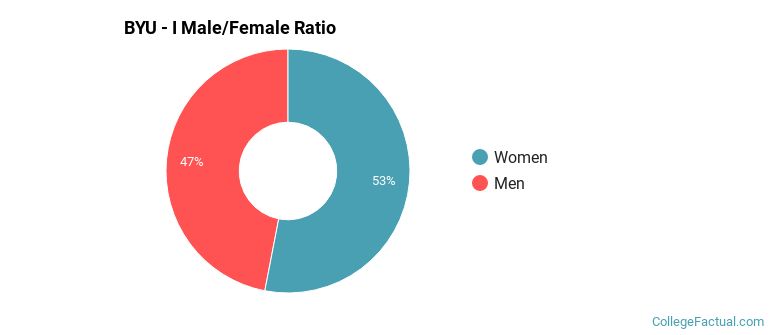
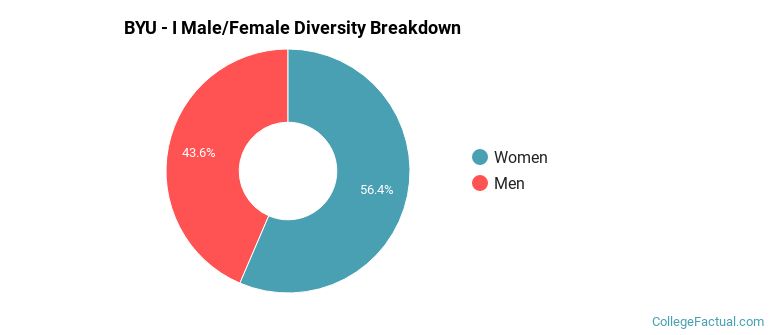
Male/Female Breakdown of Undergraduates
The full-time BYU - I undergraduate population is made up of 49.7% women, and 50.3% men.
For the gender breakdown for all students, go here.
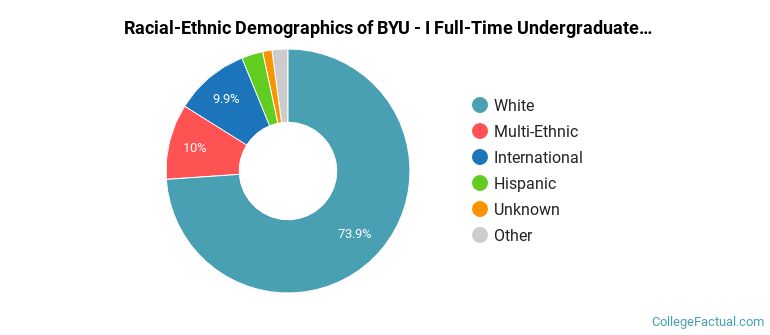
BYU - I Racial/Ethnic Breakdown of Undergraduates
| Race/Ethnicity | Number | Percent |
|---|---|---|
| White | 14,032 | 69.3% |
| Hispanic | 2,402 | 11.9% |
| Unknown | 1,349 | 6.7% |
| International | 1,196 | 5.9% |
| Black or African American | 528 | 2.6% |
| Multi-Ethnic | 466 | 2.3% |
| Asian | 192 | 0.9% |
| Native Hawaiian or Pacific Islander | 84 | 0.4% |
See racial/ethnic breakdown for all students.
| Race/Ethnicity | Number | Percent |
|---|---|---|
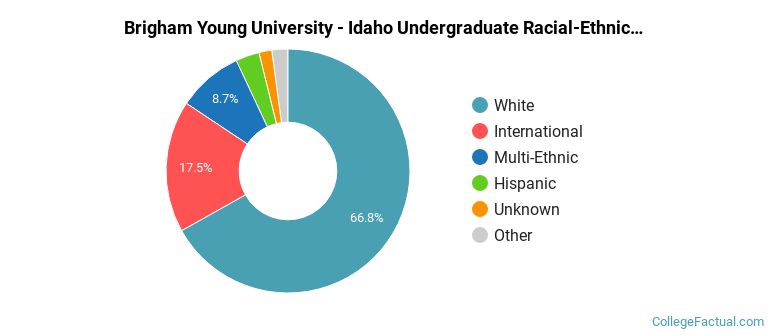
| White | 14,032 | 69.3% |
| Hispanic | 2,402 | 11.9% |
| Unknown | 1,349 | 6.7% |
| International | 1,196 | 5.9% |
| Black or African American | 528 | 2.6% |
| Multi-Ethnic | 466 | 2.3% |
| Asian | 192 | 0.9% |
| Native Hawaiian or Pacific Islander | 84 | 0.4% |
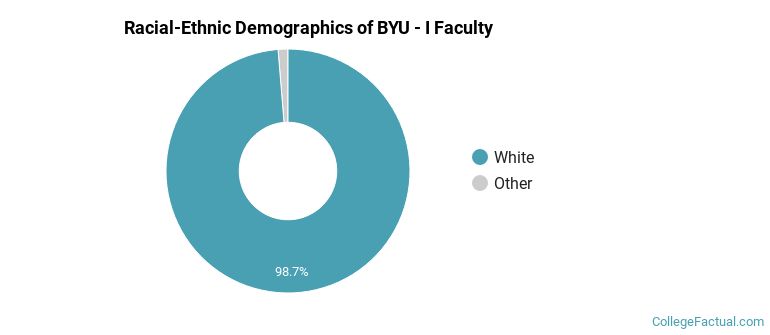
Brigham Young University-Idaho faculty racial/ethnic demographics (share of instructional staff):
| Ethnicity | Percent of Faculty |
|---|---|
| White | 93.7% |
| Unknown | 3.3% |
| Hispanic | 2.0% |
| Asian | 0.5% |
| Black or African American | 0.2% |
| Multi-Ethnic | 0.2% |
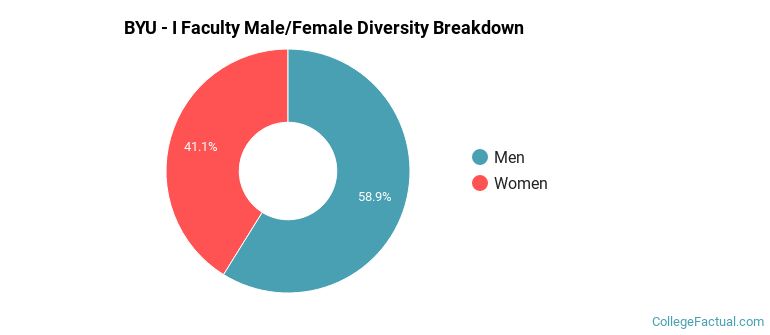
This school is more popular with men than with women.
There are approximately 10,078 female students and 10,206 male students at BYU - I.
Brigham Young University-Idaho faculty gender breakdown (share of instructional staff):
Among first-time degree-seeking undergraduates, 11.3% of BYU - I students come from within the state, and 88.7% come from out of state.
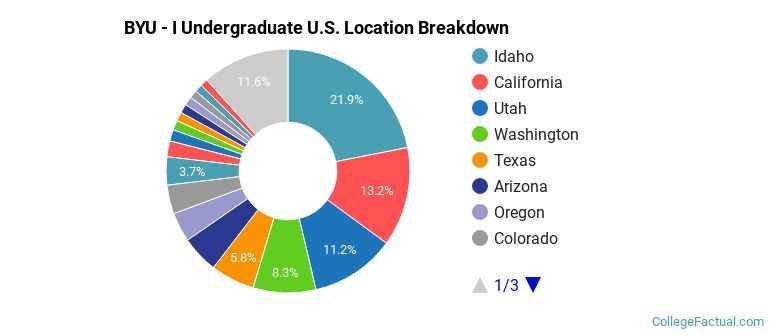
The undergraduate student body is split among 50 states (may include Washington D.C.). Click on the map for more detail.

| State | Amount | Percent |
|---|---|---|
| Idaho | 1,379 | 25.8% |
| Utah | 947 | 17.7% |
| California | 383 | 7.2% |
| Washington | 338 | 6.3% |
| Texas | 330 | 6.2% |
BYU - I enrolls about 5.9% international (nonresident) students, adding to the global diversity of the campus.
A traditional college student is defined as being between the ages of 18-21. At BYU - I, 28.1% of undergraduate students fall into that category, compared to the national average of 60%.
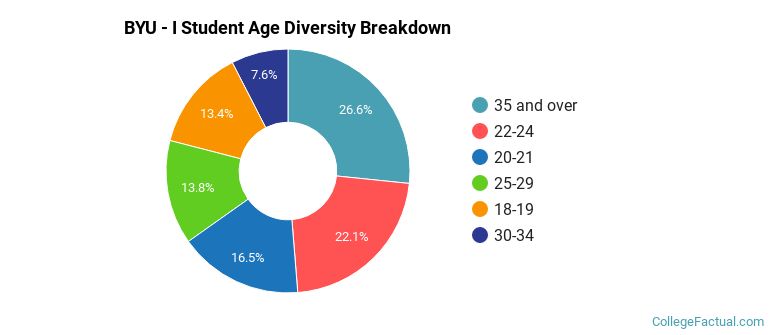
Student Age Group Amount Percent 22-24 10,774 23.6% 35 and over 10,523 23.1% 20-21 7,192 15.8% 25-29 7,007 15.4% 18-19 5,635 12.4% 30-34 3,268 7.2% Under 18 1,186 2.6%
Footnotes
*The racial-ethnic minorities count is calculated by taking the total number of students and subtracting white students, international students, and students whose race/ethnicity was unknown. This number is then divided by the total number of students at the school to obtain the racial-ethnic minorities percentage.
References