We’ve pulled together the essential facts you should know about the program at Buena Vista University. You can study it at the Bachelor’s level, with graduate study also available. Jump to any of the following sections:
College Factual ranks Buena Vista University highly for special education, ranked #158 out of 463 schools nationally.
| Ranking | Rank |
|---|---|
| Best Special Education Schools | 158 of 463 |
| Best Special Education Schools in Iowa | 2 of 5 |
| Best Special Education Schools in the Plains States Region | 9 of 46 |
The table below lists every degree level granted in special education at Buena Vista University, along with how many graduates complete each level annually.
| Degree Level | Annual Graduates |
|---|---|
| Bachelor’s | 11 |
| Master’s | 50 |
In the most recent year for which we have data, Buena Vista University awarded 11 bachelor’s degrees in special education.
Buena Vista University is not currently ranked for special education at the bachelor’s level.
Average full-time tuition and fees are listed in the table below.
| In State | Out of State | |
|---|---|---|
| Tuition | $37,518 | $41,798 |
Read more about Buena Vista University tuition and fees.
Every one of the 11 students who graduated with a bachelor’s degree in special education from Buena Vista University identified as women.
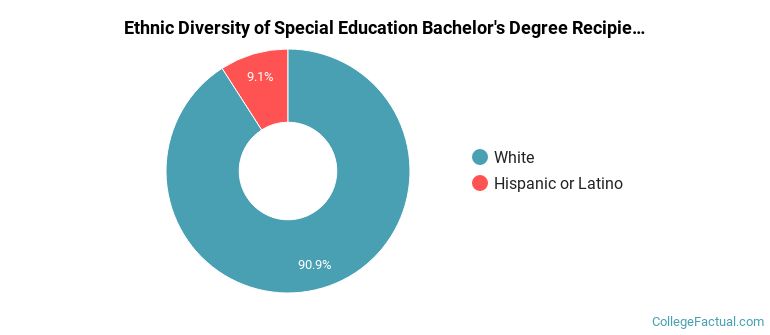
 The largest share of special education bachelor’s degree graduates at Buena Vista University are White. Approximately 91% of graduates fell into this category.
The following table and chart show the ethnic background for students who recently graduated from Buena Vista University with a bachelor’s in special education.
| Ethnic Background | Number of Students |
|---|---|
| Asian | 0 |
| Black or African American | 0 |
| Hispanic or Latino | 1 |
| White | 10 |
| Non-Resident Aliens | 0 |
| Other Races | 0 |
Buena Vista University conferred 11 bachelor’s completions in special education and teaching, general in the latest year of data — 100% to women and 0% to men. The most common background among these graduates was White (91%).
You can also pursue this field at the graduate level at Buena Vista University. Annual graduate completions by level are shown below.
| Graduate Level | Annual Graduates |
|---|---|
| Master’s Degrees in Special Education | 50 |