Cal Baptist total enrollment is approximately 11,317 students. 7,243 are undergraduates and 1,854 are graduate students.
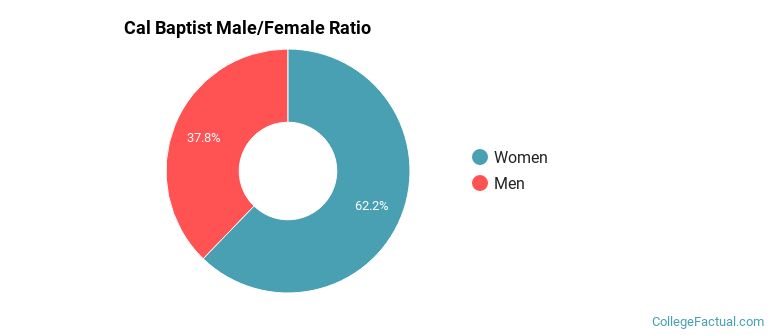
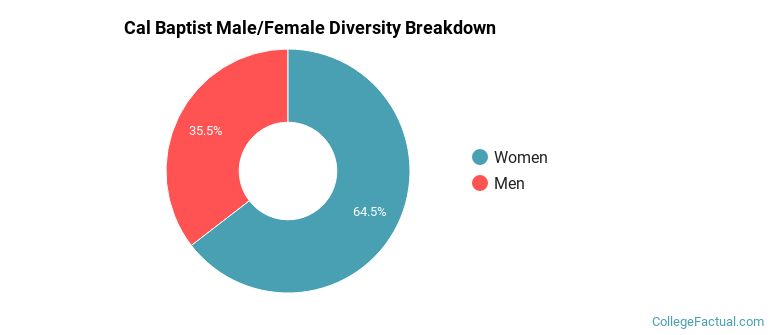
Male/Female Breakdown of Undergraduates
The full-time Cal Baptist undergraduate population is made up of 63% women, and 37% men.
For the gender breakdown for all students, go here.
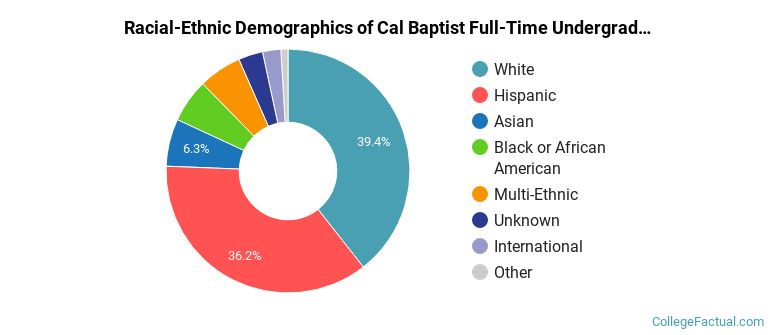
Cal Baptist Racial/Ethnic Breakdown of Undergraduates
| Race/Ethnicity | Number |
|---|---|
| Hispanic | 2,726 |
| White | 2,714 |
| Asian | 471 |
| Black or African American | 429 |
| Multi-Ethnic | 405 |
| Unknown | 236 |
| International | 165 |
| Native Hawaiian or Pacific Islander | 57 |
See racial/ethnic breakdown for all students.
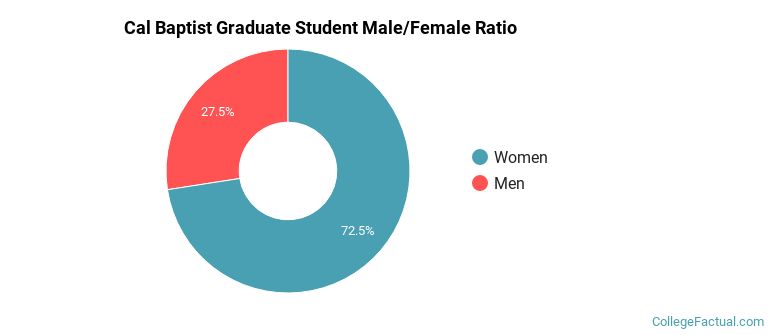
Male/Female Breakdown of Graduate Students
About 75% of full-time grad students are women, and 25% men.
For the gender breakdown for all students, go here.
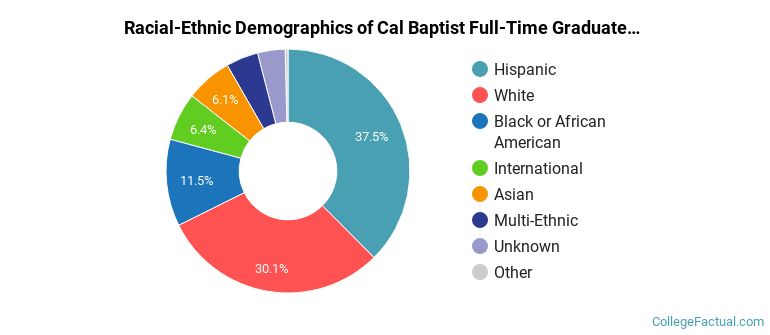
Cal Baptist Racial-Ethnic Breakdown of Graduate Students
| Race/Ethnicity | Number |
|---|---|
| Hispanic | 766 |
| White | 506 |
| Black or African American | 221 |
| Asian | 117 |
| Multi-Ethnic | 85 |
| International | 80 |
| Unknown | 60 |
| Native Hawaiian or Pacific Islander | 10 |
See racial/ethnic breakdown for all students.

| Race/Ethnicity | Number |
|---|---|
| Hispanic | 4,327 |
| White | 3,832 |
| Black or African American | 917 |
| Asian | 754 |
| Multi-Ethnic | 594 |
| Unknown | 429 |
| International | 316 |
| Native Hawaiian or Pacific Islander | 86 |
There are approximately 7,428 female students and 3,889 male students at Cal Baptist.
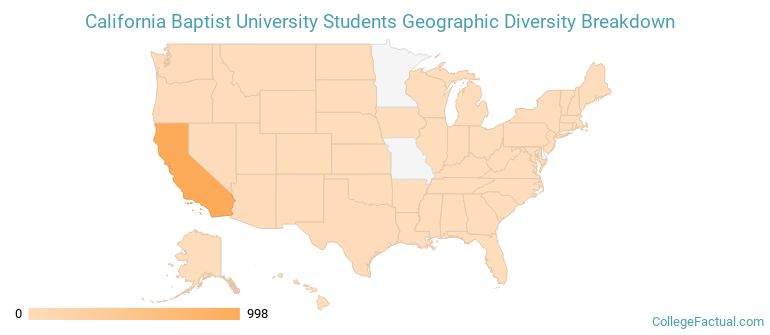
Cal Baptist ranks 1,050 out of 2,183 when it comes to geographic diversity.
10.09% of Cal Baptist students come from out of state, and 0% come from out of the country.
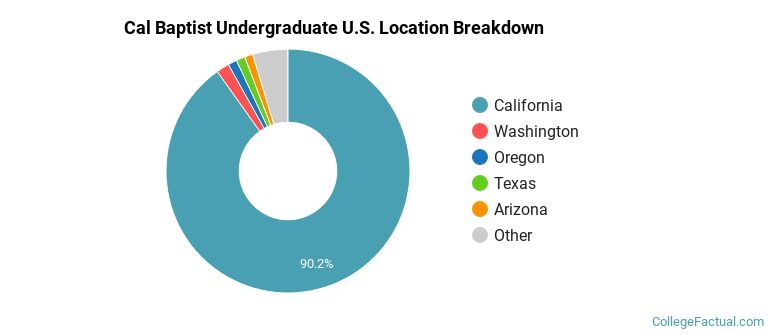
The undergraduate student body is split among 24 states (may include Washington D.C.). Click on the map for more detail.
| State | Amount |
|---|---|
| California | 998 |
| Washington | 19 |
| Oregon | 13 |
| Texas | 13 |
| Arizona | 12 |
Students from 43 countries are represented at this school, with the majority of the international students coming from China, India, and Rwanda.
Learn more about international students at Cal Baptist.
A traditional college student is defined as being between the ages of 18-21. At Cal Baptist, 42.88% of students fall into that category, compared to the national average of 60%.
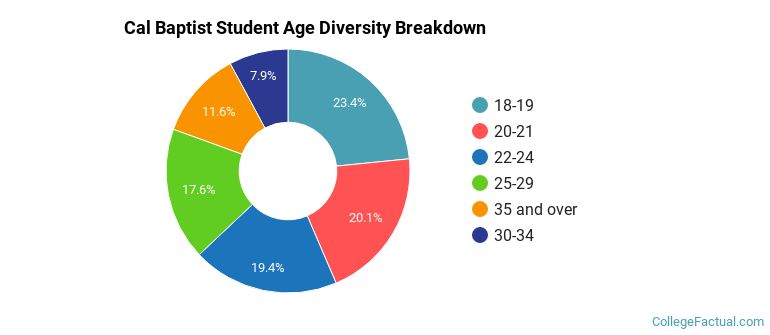
| Student Age Group | Amount |
|---|---|
| 18-19 | 2,291 |
| 20-21 | 1,972 |
| 22-24 | 1,901 |
| 25-29 | 1,722 |
| 35 and over | 1,135 |
| 30-34 | 769 |
| Under 18 | 0 |
Footnotes
*The racial-ethnic minorities count is calculated by taking the total number of students and subtracting white students, international students, and students whose race/ethnicity was unknown. This number is then divided by the total number of students at the school to obtain the racial-ethnic minorities percentage.
References
Department of Homeland Security Citizenship and Immigration Services
Image Credit: By Jeremylofgren under License
Read College Factual's Diversity Ranking Methodology.