Jump to any of the following sections:
The bachelor's program at CSUSB was ranked #232 on College Factual's Best Schools for social sciences list. It is also ranked #33 in California.
| Ranking Type | Rank |
|---|---|
| Best Social Sciences Master’s Degree Schools | 165 |
| Best Social Sciences Graduate Degree Schools | 172 |
| Best Social Sciences Bachelor’s Degree Schools | 221 |
| Best Social Sciences Schools | 232 |
During the 2021-2022 academic year, California State University - San Bernardino handed out 369 bachelor's degrees in social sciences. This is a decrease of 4% over the previous year when 384 degrees were handed out.
In 2022, 10 students received their master’s degree in social sciences from CSUSB. This makes it the #282 most popular school for social sciences master’s degree candidates in the country.
The average full-time tuition and fees for undergraduates are shown in the table below.
| In State | Out of State | |
|---|---|---|
| Tuition | $5,742 | $17,622 |
| Fees | $1,933 | $1,933 |
| Books and Supplies | $788 | $788 |
| On Campus Room and Board | $12,996 | $12,996 |
| On Campus Other Expenses | $3,738 | $3,738 |
Learn more about CSUSB tuition and fees.
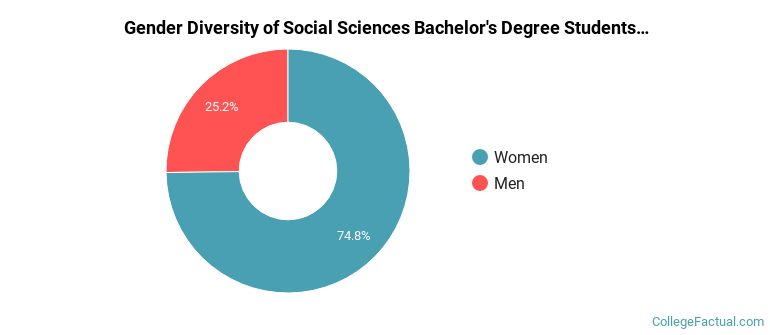
In the 2021-2022 academic year, 369 students earned a bachelor's degree in social sciences from CSUSB. About 75% of these graduates were women and the other 25% were men.
The majority of the bachelor's degree graduates for this major are Hispanic or Latino. In the most recent graduating class for which data is available, 71% of grads fell into this category.
The following table and chart show the ethnic background for students who recently graduated from California State University - San Bernardino with a bachelor's in social sciences.
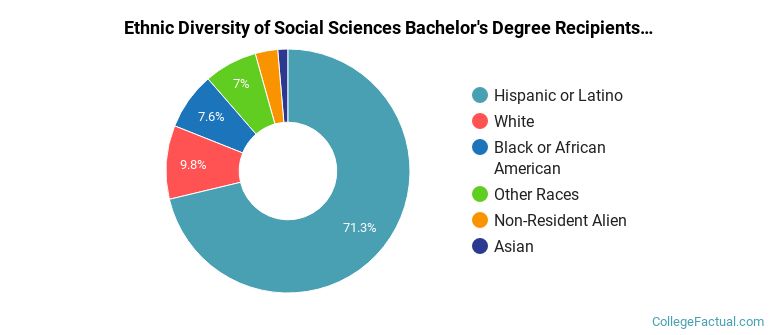
| Ethnic Background | Number of Students |
|---|---|
| Asian | 5 |
| Black or African American | 28 |
| Hispanic or Latino | 263 |
| White | 36 |
| Non-Resident Aliens | 11 |
| Other Races | 26 |
CSUSB does not offer an online option for its social sciences bachelor’s degree program at this time. To see if the school offers distance learning options in other areas, visit the CSUSB Online Learning page.
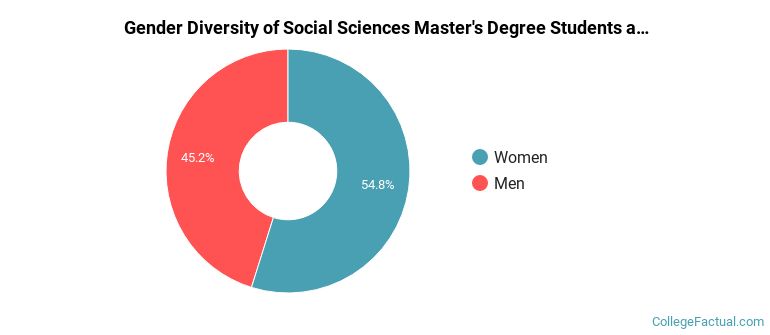
During the 2021-2022 academic year, 31 social sciences majors earned their master's degree from CSUSB. Of these graduates, 45% were men and 55% were women.
The following table and chart show the ethnic background for students who recently graduated from California State University - San Bernardino with a master's in social sciences.
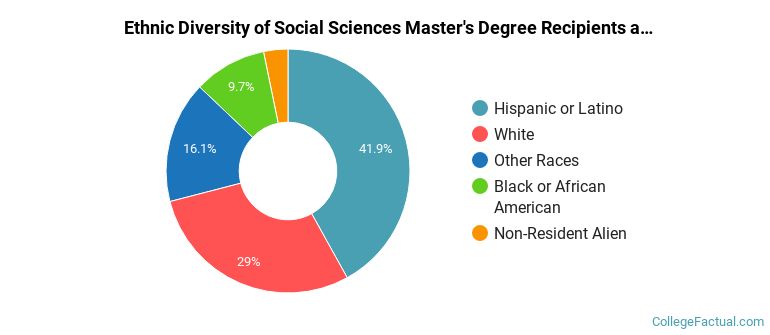
| Ethnic Background | Number of Students |
|---|---|
| Asian | 0 |
| Black or African American | 3 |
| Hispanic or Latino | 13 |
| White | 9 |
| Non-Resident Aliens | 1 |
| Other Races | 5 |
Take a look at the following statistics related to the make-up of the social sciences majors at California State University - San Bernardino.
Social Sciences students may decide to major in one of the following focus areas. Individual majors may not be available for all degree levels.
| Major | Annual Graduates |
|---|---|
| Sociology | 277 |
| Political Science & Government | 40 |
| Economics | 26 |
| General Social Sciences | 24 |
| International Relations & National Security | 17 |
| Anthropology | 16 |
| Related Major | Annual Graduates |
|---|---|
| Liberal Arts / Sciences & Humanities | 223 |
| English Language & Literature | 182 |
| Communication & Journalism | 166 |
| Family, Consumer & Human Sciences | 120 |
| History | 80 |
More about our data sources and methodologies.