We've gathered data and other essential information about the program, such as the ethnicity of students, how many students graduated in recent times, and more. In addition, we cover how Camden County College ranks in comparison to other schools with dental support programs.
Jump to any of the following sections:
The bachelor's program at Camden County College was ranked #163 on College Factual's Best Schools for dental support list.
During the 2022-2023 academic year, part-time undergraduate students at Camden County College paid an average of $119 per credit hour. No discount was available for in-state students. Information about average full-time undergraduate tuition and fees is shown in the table below.
| In State | Out of State | |
|---|---|---|
| Tuition | $2,856 | $2,856 |
| Fees | $1,200 | $1,200 |
| Books and Supplies | $1,800 | $1,800 |
Learn more about Camden County College tuition and fees.
Camden County College does not offer an online option for its dental support bachelor’s degree program at this time. To see if the school offers distance learning options in other areas, visit the Camden County College Online Learning page.
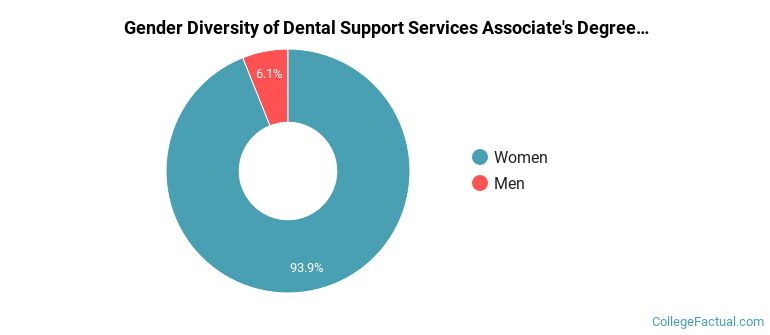
Of the 33 students who earned an associate's degree in Dental Support Services from Camden County College in 2021-2022, 6% were men and 94% were women.
The majority of the students with this major are white. About 52% of 2022 graduates were in this category.
The following table and chart show the ethnic background for students who recently graduated from Camden County College with a associate's in dental support.
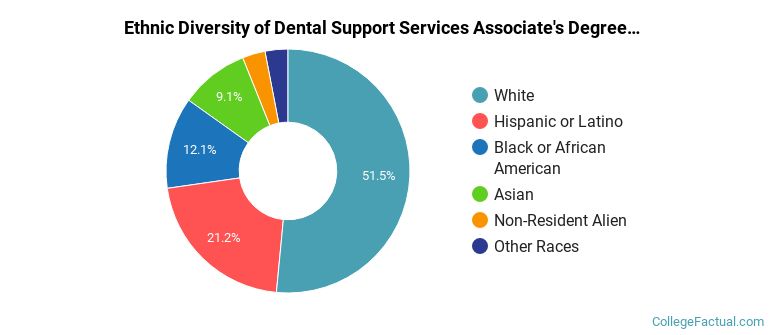
| Ethnic Background | Number of Students |
|---|---|
| Asian | 3 |
| Black or African American | 4 |
| Hispanic or Latino | 7 |
| White | 17 |
| Non-Resident Aliens | 1 |
| Other Races | 1 |
| Related Major | Annual Graduates |
|---|---|
| Nursing | 91 |
| Practical Nursing & Nursing Assistants | 39 |
| Health & Medical Administrative Services | 38 |
| Mental & Social Health Services | 29 |
| Health Sciences & Services | 20 |