We've gathered data and other essential information about the program, such as the ethnicity of students, how many students graduated in recent times, and more. We've also included details on how CFCC ranks compared to other colleges offering a major in allied health.
Go directly to any of the following sections:
Learn about start dates, transferring credits, availability of financial aid, and more by contacting the universities below.
Take your associate degree in an allied health field to the next level with this specialized transfer friendly online bachelor of science from Southern New Hampshire University.
The bachelor's program at CFCC was ranked #718 on College Factual's Best Schools for allied health list.
In 2022-2023, the average part-time undergraduate tuition at CFCC was $268 per credit hour for out-of-state students. The average for in-state students was $76 per credit hour. The average full-time tuition and fees for undergraduates are shown in the table below.
| In State | Out of State | |
|---|---|---|
| Tuition | $2,432 | $8,576 |
| Fees | $316 | $316 |
| Books and Supplies | $1,600 | $1,600 |
Learn more about CFCC tuition and fees.
Online degrees for the CFCC allied health bachelor’s degree program are not available at this time. To see if the school offers distance learning options in other areas, visit the CFCC Online Learning page.
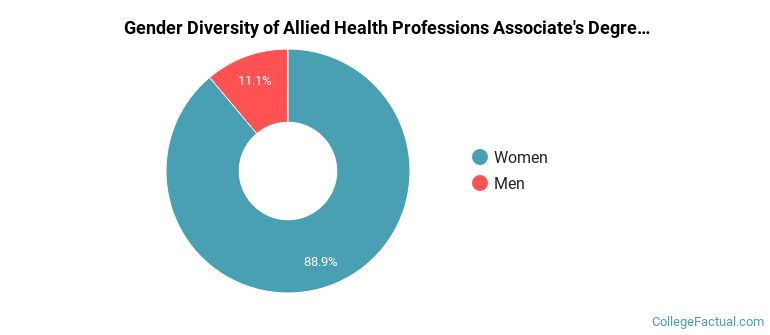
During the 2021-2022 academic year, 36 allied health majors earned their associate's degree from CFCC. Of these graduates, 11% were men and 89% were women.
The majority of associate's degree recipients in this major at CFCC are white. In the most recent graduating class for which data is available, 83% of students fell into this category.
The following table and chart show the ethnic background for students who recently graduated from Cape Fear Community College with a associate's in allied health.
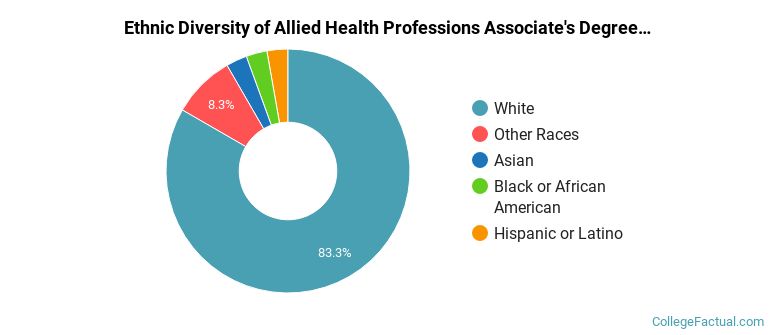
| Ethnic Background | Number of Students |
|---|---|
| Asian | 1 |
| Black or African American | 1 |
| Hispanic or Latino | 1 |
| White | 30 |
| Non-Resident Aliens | 0 |
| Other Races | 3 |
| Related Major | Annual Graduates |
|---|---|
| Nursing | 75 |
| Allied Health & Medical Assisting Services | 38 |
| Health & Medical Administrative Services | 37 |
| Dental Support Services | 34 |
| Practical Nursing & Nursing Assistants | 23 |
