We’ve pulled together the essential facts you should know about the program at Capital University. Degrees are awarded at the Bachelor’s level, with graduate study also available. It ranks as high as #9 out of 16 schools (Bachelor’s level) by College Factual. Jump to any of the following sections:
By College Factual’s measure, Capital University as a strong choice for teacher education subject specific, placing at #369 out of 554 schools nationally.
| Ranking | Rank |
|---|---|
| Best Teacher Education Subject Specific Schools | 369 of 554 |
| Best Teacher Education Subject Specific Schools in Ohio | 10 of 20 |
| Best Teacher Education Subject Specific Schools in the Great Lakes Region | 70 of 100 |
The following degree levels are offered in teacher education subject specific at Capital University, along with how many graduates complete each level annually.
| Degree Level | Annual Graduates |
|---|---|
| Bachelor’s | 28 |
| Master’s | 9 |
During the most recent reporting year, Capital University awarded 28 bachelor’s degrees in teacher education subject specific.
Capital University ranks competitively among schools offering teacher education subject specific at the bachelor’s level. In particular it placed #9 out of 16 schools by College Factual.
Teacher Education Subject Specific majors who earn their bachelor’s degree from Capital University earn a median of $43,382 a year. This is lower than $55,523, the median for all majors at Capital University.
While getting their bachelor’s degree at Capital University, teacher education subject specific students accumulate a median of $27,000 in student loans. This is lower than $28,269, the typical median for all majors at Capital University.

Information about average full-time undergraduate tuition and fees is shown in the table below.
| In State | Out of State | |
|---|---|---|
| Tuition | $38,928 | $42,744 |
| Fees | $490 | $490 |
Read more about Capital University tuition and fees.
In the most recent graduating class, 50% of teacher education subject specific bachelor’s degrees went to men and 50% went to women.
 The majority of teacher education subject specific bachelor’s degree graduates at Capital University were White. About 82% of graduates fell into this category.
The following table and chart show the ethnic background for students who recently graduated from Capital University with a bachelor’s in teacher education subject specific.
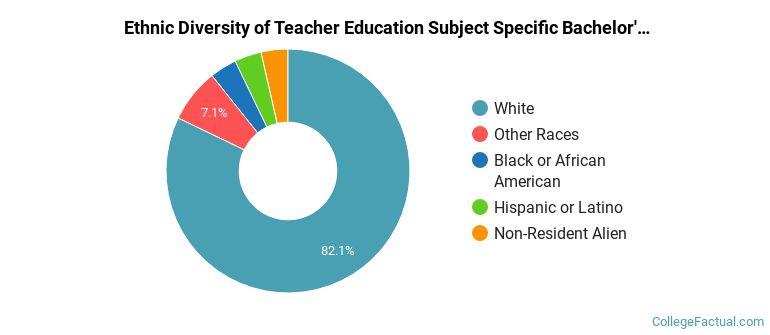
| Ethnic Background | Number of Students |
|---|---|
| Asian | 0 |
| Black or African American | 1 |
| Hispanic or Latino | 1 |
| White | 23 |
| Non-Resident Aliens | 1 |
| Other Races | 2 |
Capital University awarded 18 bachelor’s completions in music teacher education in the latest year of data — 39% to women and 61% to men. The largest share of these graduates were White (78%).
Capital University conferred 3 bachelor’s completions in english/language arts teacher education recently — 100% to women and 0% to men. The most common background among these graduates was White (100%).
Capital University granted 3 bachelor’s degrees in social studies teacher education recently — 67% to women and 33% to men. The largest share of these graduates were White (67%).
Capital University awarded 2 bachelor’s completions in art teacher education in the most recent reporting year — 100% to women and 0% to men. The largest share of these graduates were White (100%).
Capital University granted 1 bachelor’s completion in mathematics teacher education in the most recent reporting year — 0% to women and 100% to men. The most common background among these graduates was White (100%).
Capital University granted 1 bachelor’s completion in science teacher education/general science teacher education recently — 0% to women and 100% to men. The largest share of these graduates were White (100%).
Graduate study is also available at Capital University. The following graduate award levels are reported.
| Graduate Level | Annual Graduates |
|---|---|
| Master’s Degrees in Teacher Education Subject Specific | 9 |
