Go directly to any of the following sections:
The bachelor's program at Central Lakes College was ranked #19 on College Factual's Best Schools for precision production list.
In 2022-2023, the average part-time undergraduate tuition at Central Lakes College was $181 per credit hour for both in-state and out-of-state students. Information about average full-time undergraduate tuition and fees is shown in the table below.
| In State | Out of State | |
|---|---|---|
| Tuition | $5,424 | $5,424 |
| Fees | $785 | $785 |
| Books and Supplies | $1,000 | $1,000 |
Learn more about Central Lakes College tuition and fees.
Online degrees for the Central Lakes College precision production bachelor’s degree program are not available at this time. To see if the school offers distance learning options in other areas, visit the Central Lakes College Online Learning page.
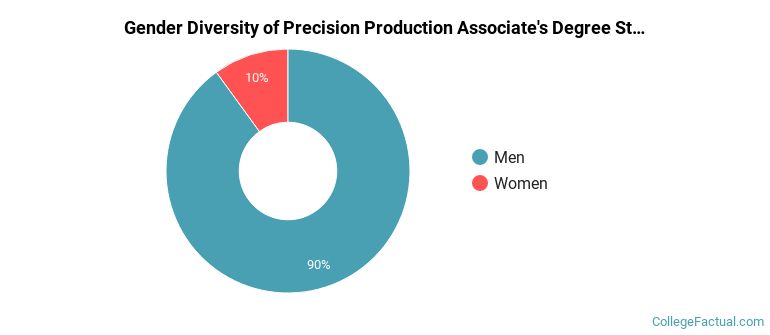
Of the 10 students who graduated with a Associate’s in precision production from Central Lakes College in 2022, 90% were men and 10% were women.
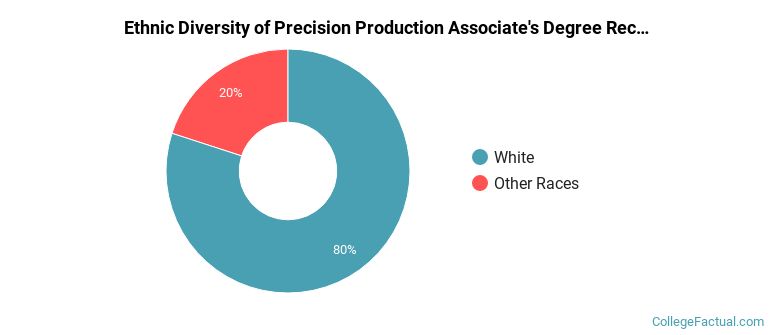
The majority of associate's degree recipients in this major at Central Lakes College are white. In the most recent graduating class for which data is available, 80% of students fell into this category.
The following table and chart show the ethnic background for students who recently graduated from Central Lakes College - Brainerd with a associate's in precision production.
| Ethnic Background | Number of Students |
|---|---|
| Asian | 0 |
| Black or African American | 0 |
| Hispanic or Latino | 0 |
| White | 8 |
| Non-Resident Aliens | 0 |
| Other Races | 2 |
Precision Production students may decide to major in one of the following focus areas. Individual majors may not be available for all degree levels.
| Major | Annual Graduates |
|---|---|
| Precision Metal Working | 41 |
| Related Major | Annual Graduates |
|---|---|
| Mechanic & Repair Technologies | 56 |
| Transportation & Materials Moving | 46 |